OP
OP
Andystroh
Well-Known Member
- Thread starter
- #16
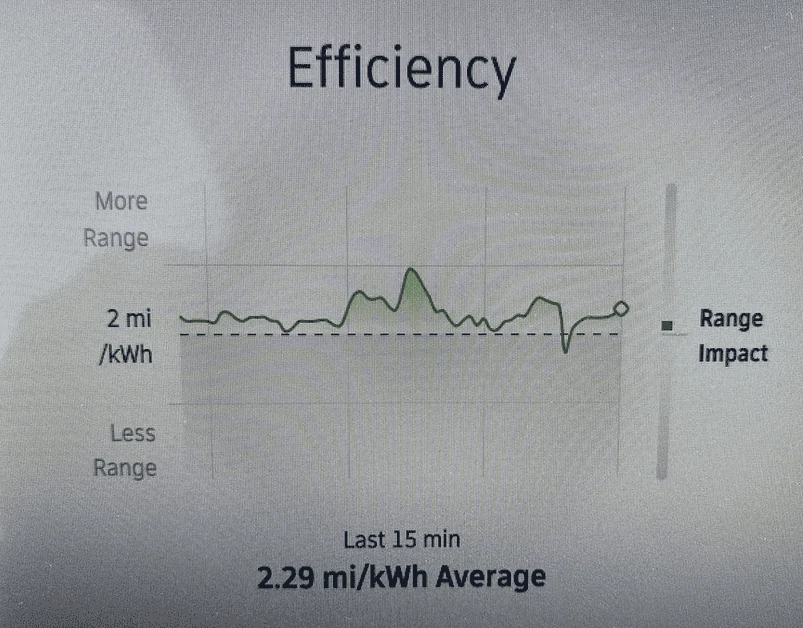
I understand the vehicle is getting the value shown below the graph, my question is only “why 2 as a baseline”? I understand it won’t always meet the EPA range, but I thought it would be more valuable to see “efficiency vs manufacturer quoted estimate” than “efficiency vs arbitrary value”. Good point above on the AT tires, if this baseline changes in a vehicle with 21” to approximately 2.3 then this would make perfect sense, since they stated lower range with the 20”. I’ll have to see if I can find any images of another baseline.2.29 mi/kWh sounds about right. That would give a range of 309 miles.
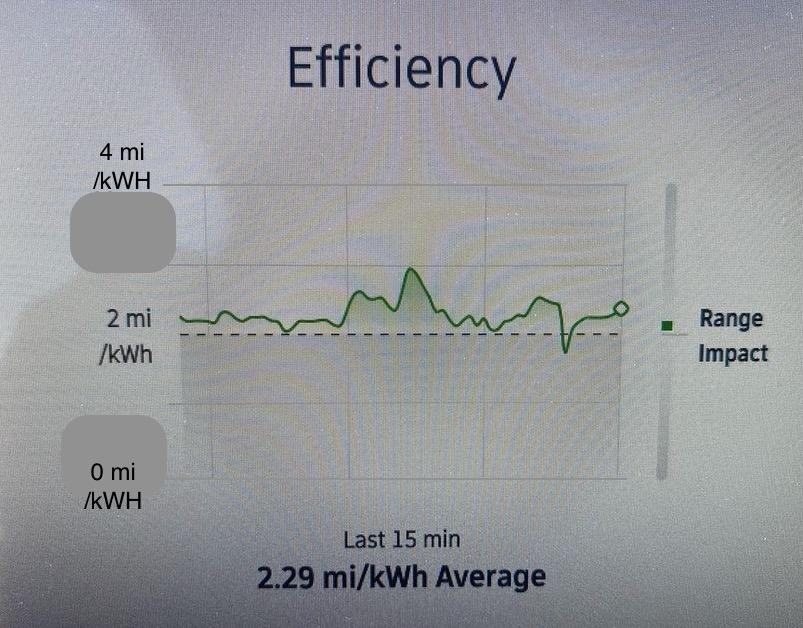
The 2 mi/kWh seen on the left in that photo is simply the scale for the graph and should not be confused for the actual mi/kWh that vehicle is averaging. I think the OP may be looking at that and mistakenly thinking the vehicle is only getting 2 mi/kWh.
Sponsored