GatorRiv
Well-Known Member
- Joined
- Sep 21, 2023
- Threads
- 16
- Messages
- 93
- Reaction score
- 87
- Location
- Pembroke Pines, FL
- Vehicles
- Forest Green 2023 R1T
- Occupation
- Executive
- Thread starter
- #1
I know the efficiency and range stats are a bit of a mystery. I wonder how many of below are known or strongly suspected
1. Is the remaining range impacted by your personal driving habits (ie. Average efficiency)? or battery health (ie, will the range decline over time)? Or is it only impacted by the drive mode you select? I presume temperature is not a factor although probably should be.
2. If you go to a trip meter and recompute your efficiency you will come up short of the presented efficiency. For me is is 2.38 vs 2.48. is this difference because the stated efficiency is attributing some energy usage to climate and accessories? Is it throwing out energy usage when in hold instead of drive (related to question #3)
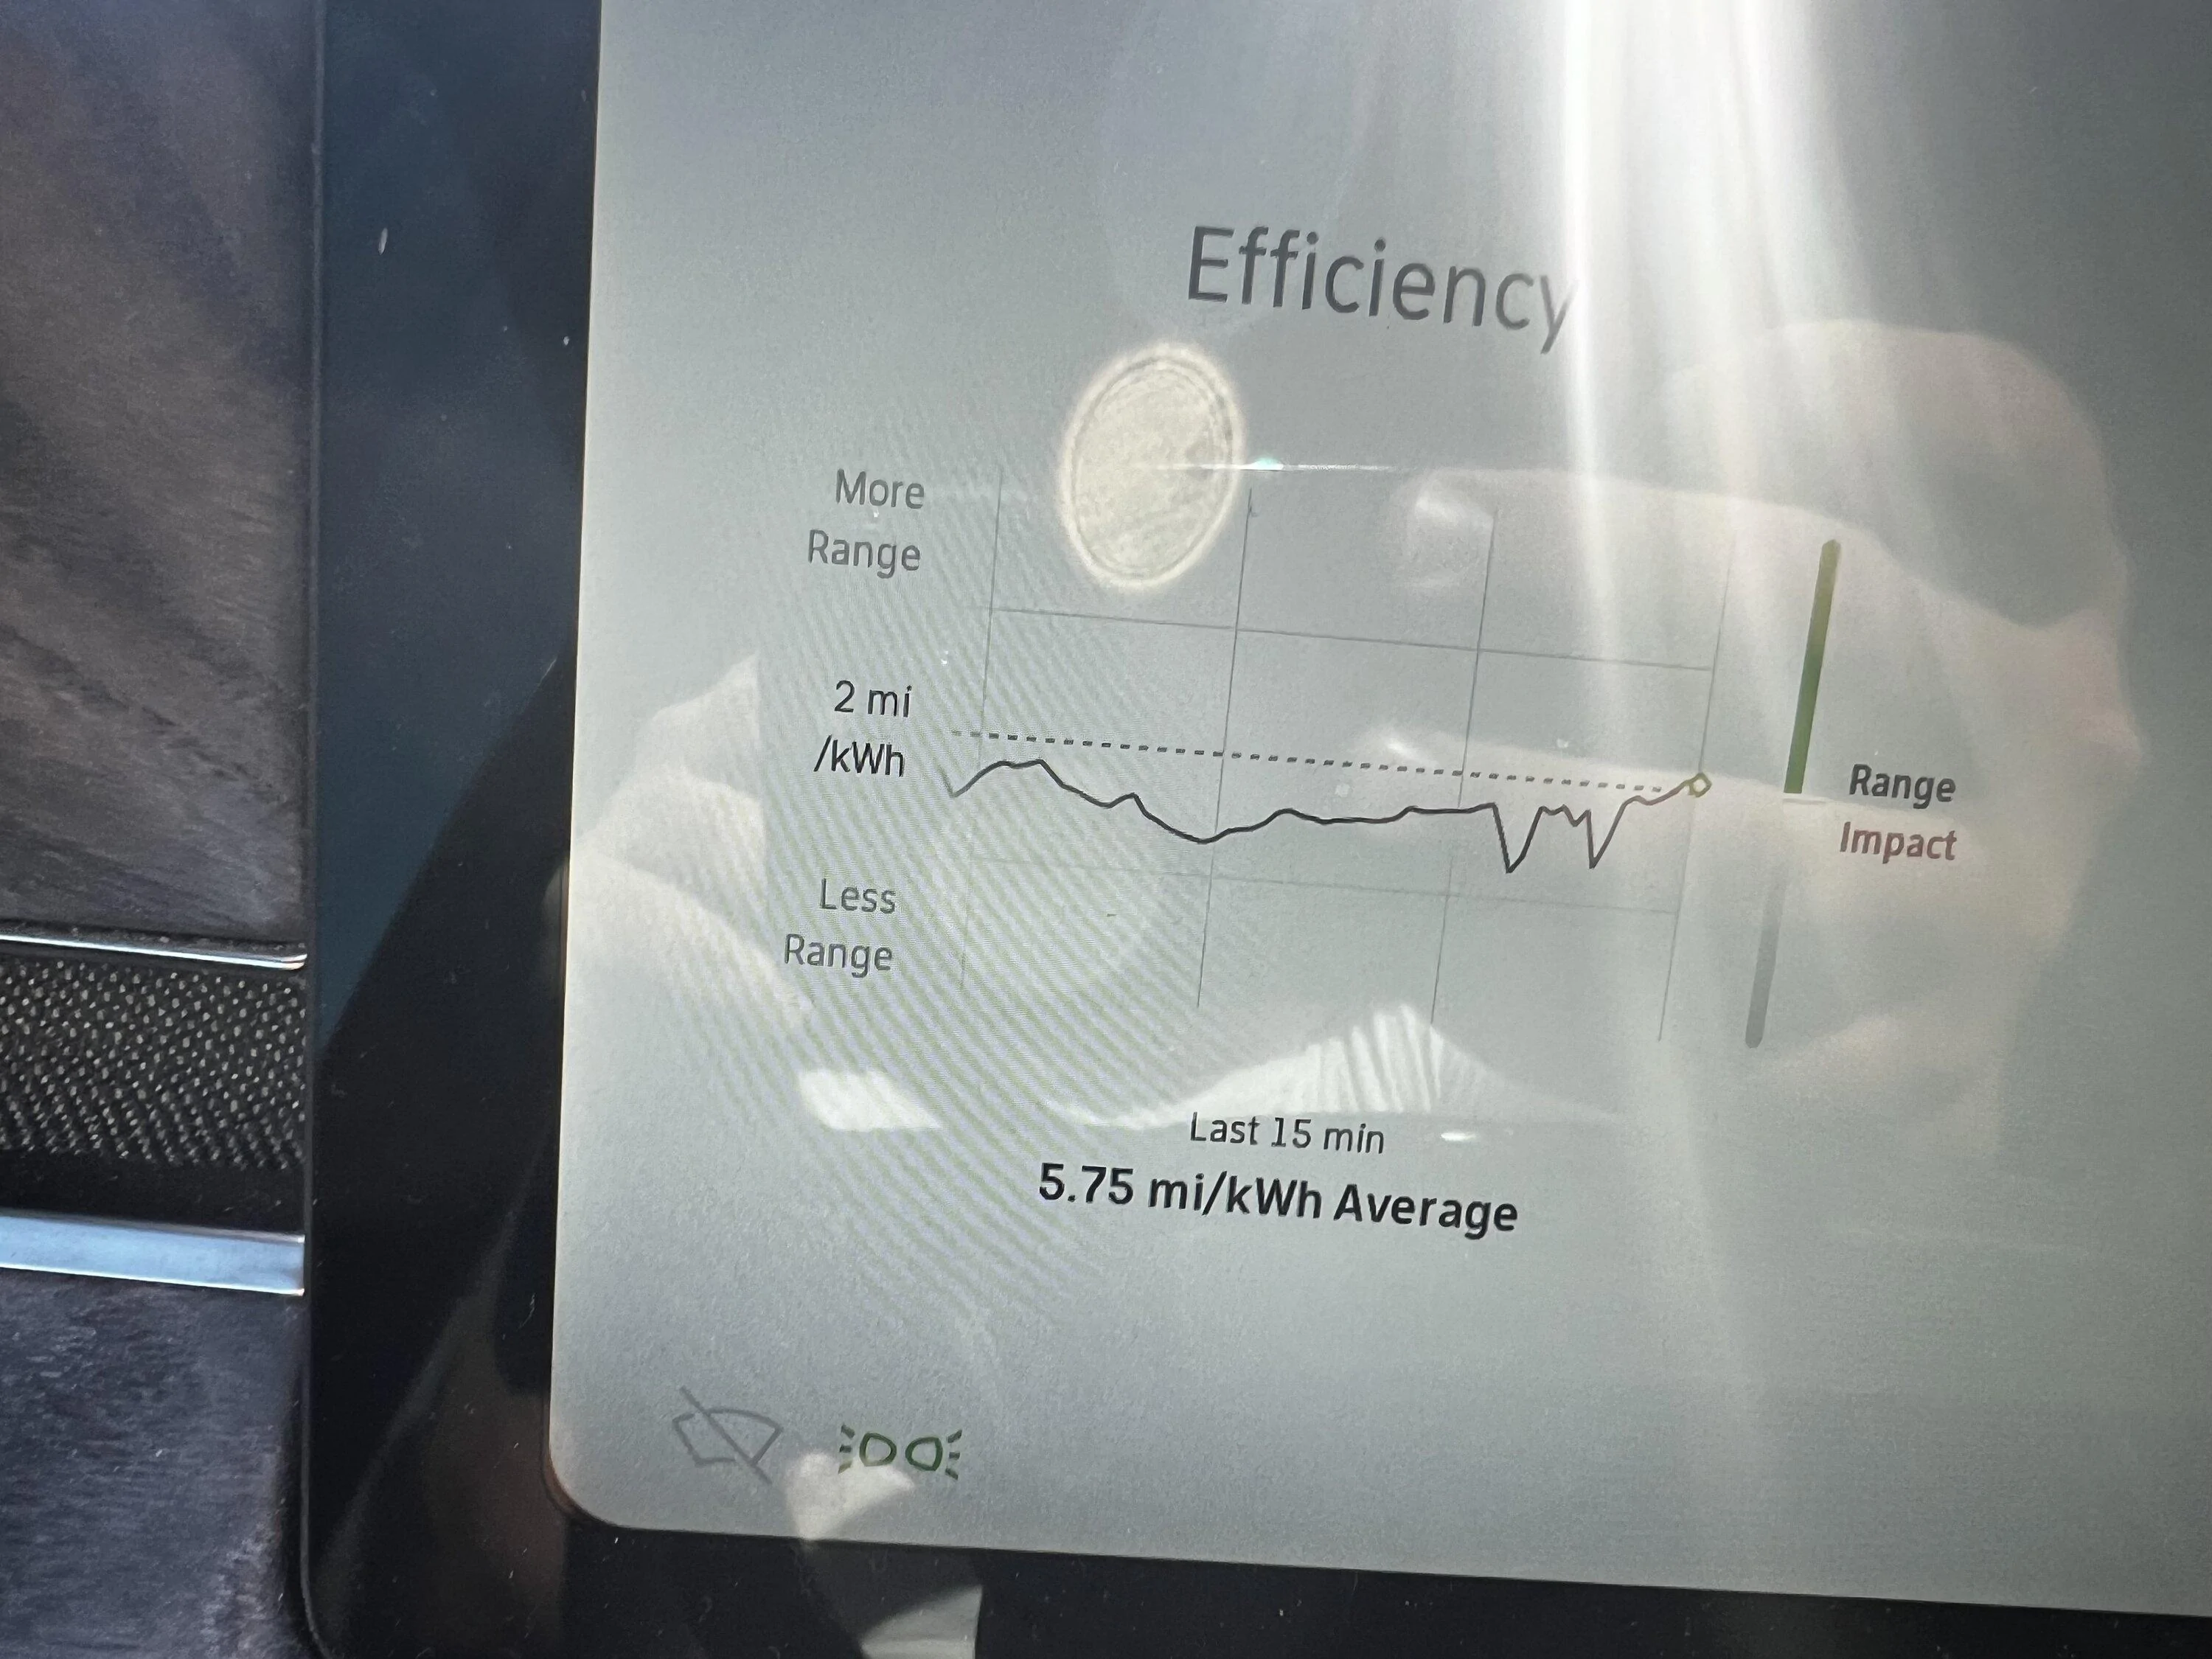
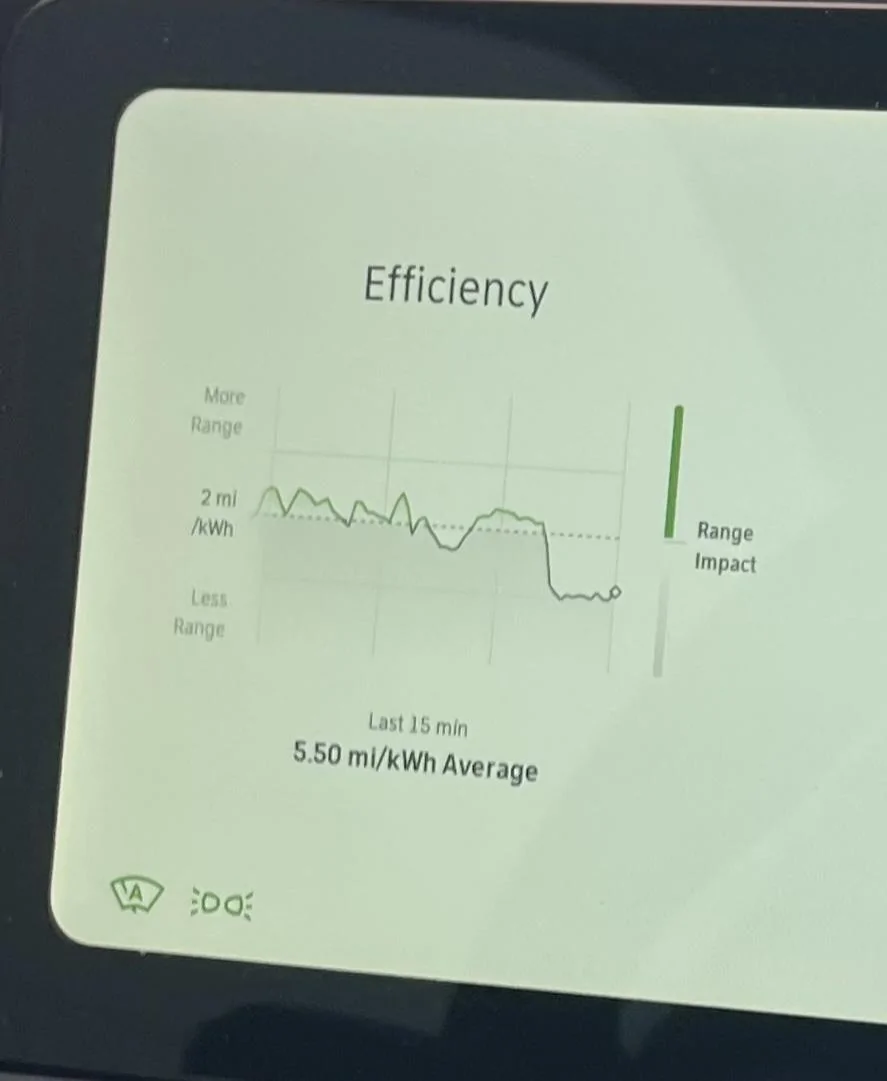
3. On the efficiency graph on driver's screen, I presume it is 15 minutes left to right. I don't understand it given when I sit at a light for 5 mins it only slowly declines often still green instead of going to 0 as it should. It also seems each "point" isn't quite an instant efficiency measure but rather a few second average (at least when moving) other than when you are stopped. For a highly reactive instant efficiency view you can look to the graph to the right of the speedometer.
4. Lastly that range impact bar to the right of the chart. Sometimes the bar is fat, sometimes thin. Sometimes green, sometimes gray, sometimes blue. I presume this is a comparison of the 15 min average against something. Is it comparing against generic driver efficiency? Against my historic efficiency? I presume the thicker the more the delta against whatever it is comparing against. Even that is weird given it is sometimes (I think) a thick gray. No idea what that might be implying.....maybe wide swings on the 15 min chart but close to my average?
Thanks for any thoughts
1. Is the remaining range impacted by your personal driving habits (ie. Average efficiency)? or battery health (ie, will the range decline over time)? Or is it only impacted by the drive mode you select? I presume temperature is not a factor although probably should be.
2. If you go to a trip meter and recompute your efficiency you will come up short of the presented efficiency. For me is is 2.38 vs 2.48. is this difference because the stated efficiency is attributing some energy usage to climate and accessories? Is it throwing out energy usage when in hold instead of drive (related to question #3)
3. On the efficiency graph on driver's screen, I presume it is 15 minutes left to right. I don't understand it given when I sit at a light for 5 mins it only slowly declines often still green instead of going to 0 as it should. It also seems each "point" isn't quite an instant efficiency measure but rather a few second average (at least when moving) other than when you are stopped. For a highly reactive instant efficiency view you can look to the graph to the right of the speedometer.
4. Lastly that range impact bar to the right of the chart. Sometimes the bar is fat, sometimes thin. Sometimes green, sometimes gray, sometimes blue. I presume this is a comparison of the 15 min average against something. Is it comparing against generic driver efficiency? Against my historic efficiency? I presume the thicker the more the delta against whatever it is comparing against. Even that is weird given it is sometimes (I think) a thick gray. No idea what that might be implying.....maybe wide swings on the 15 min chart but close to my average?
Thanks for any thoughts
Sponsored
Last edited: