Sponsored
Thedude
Well-Known Member
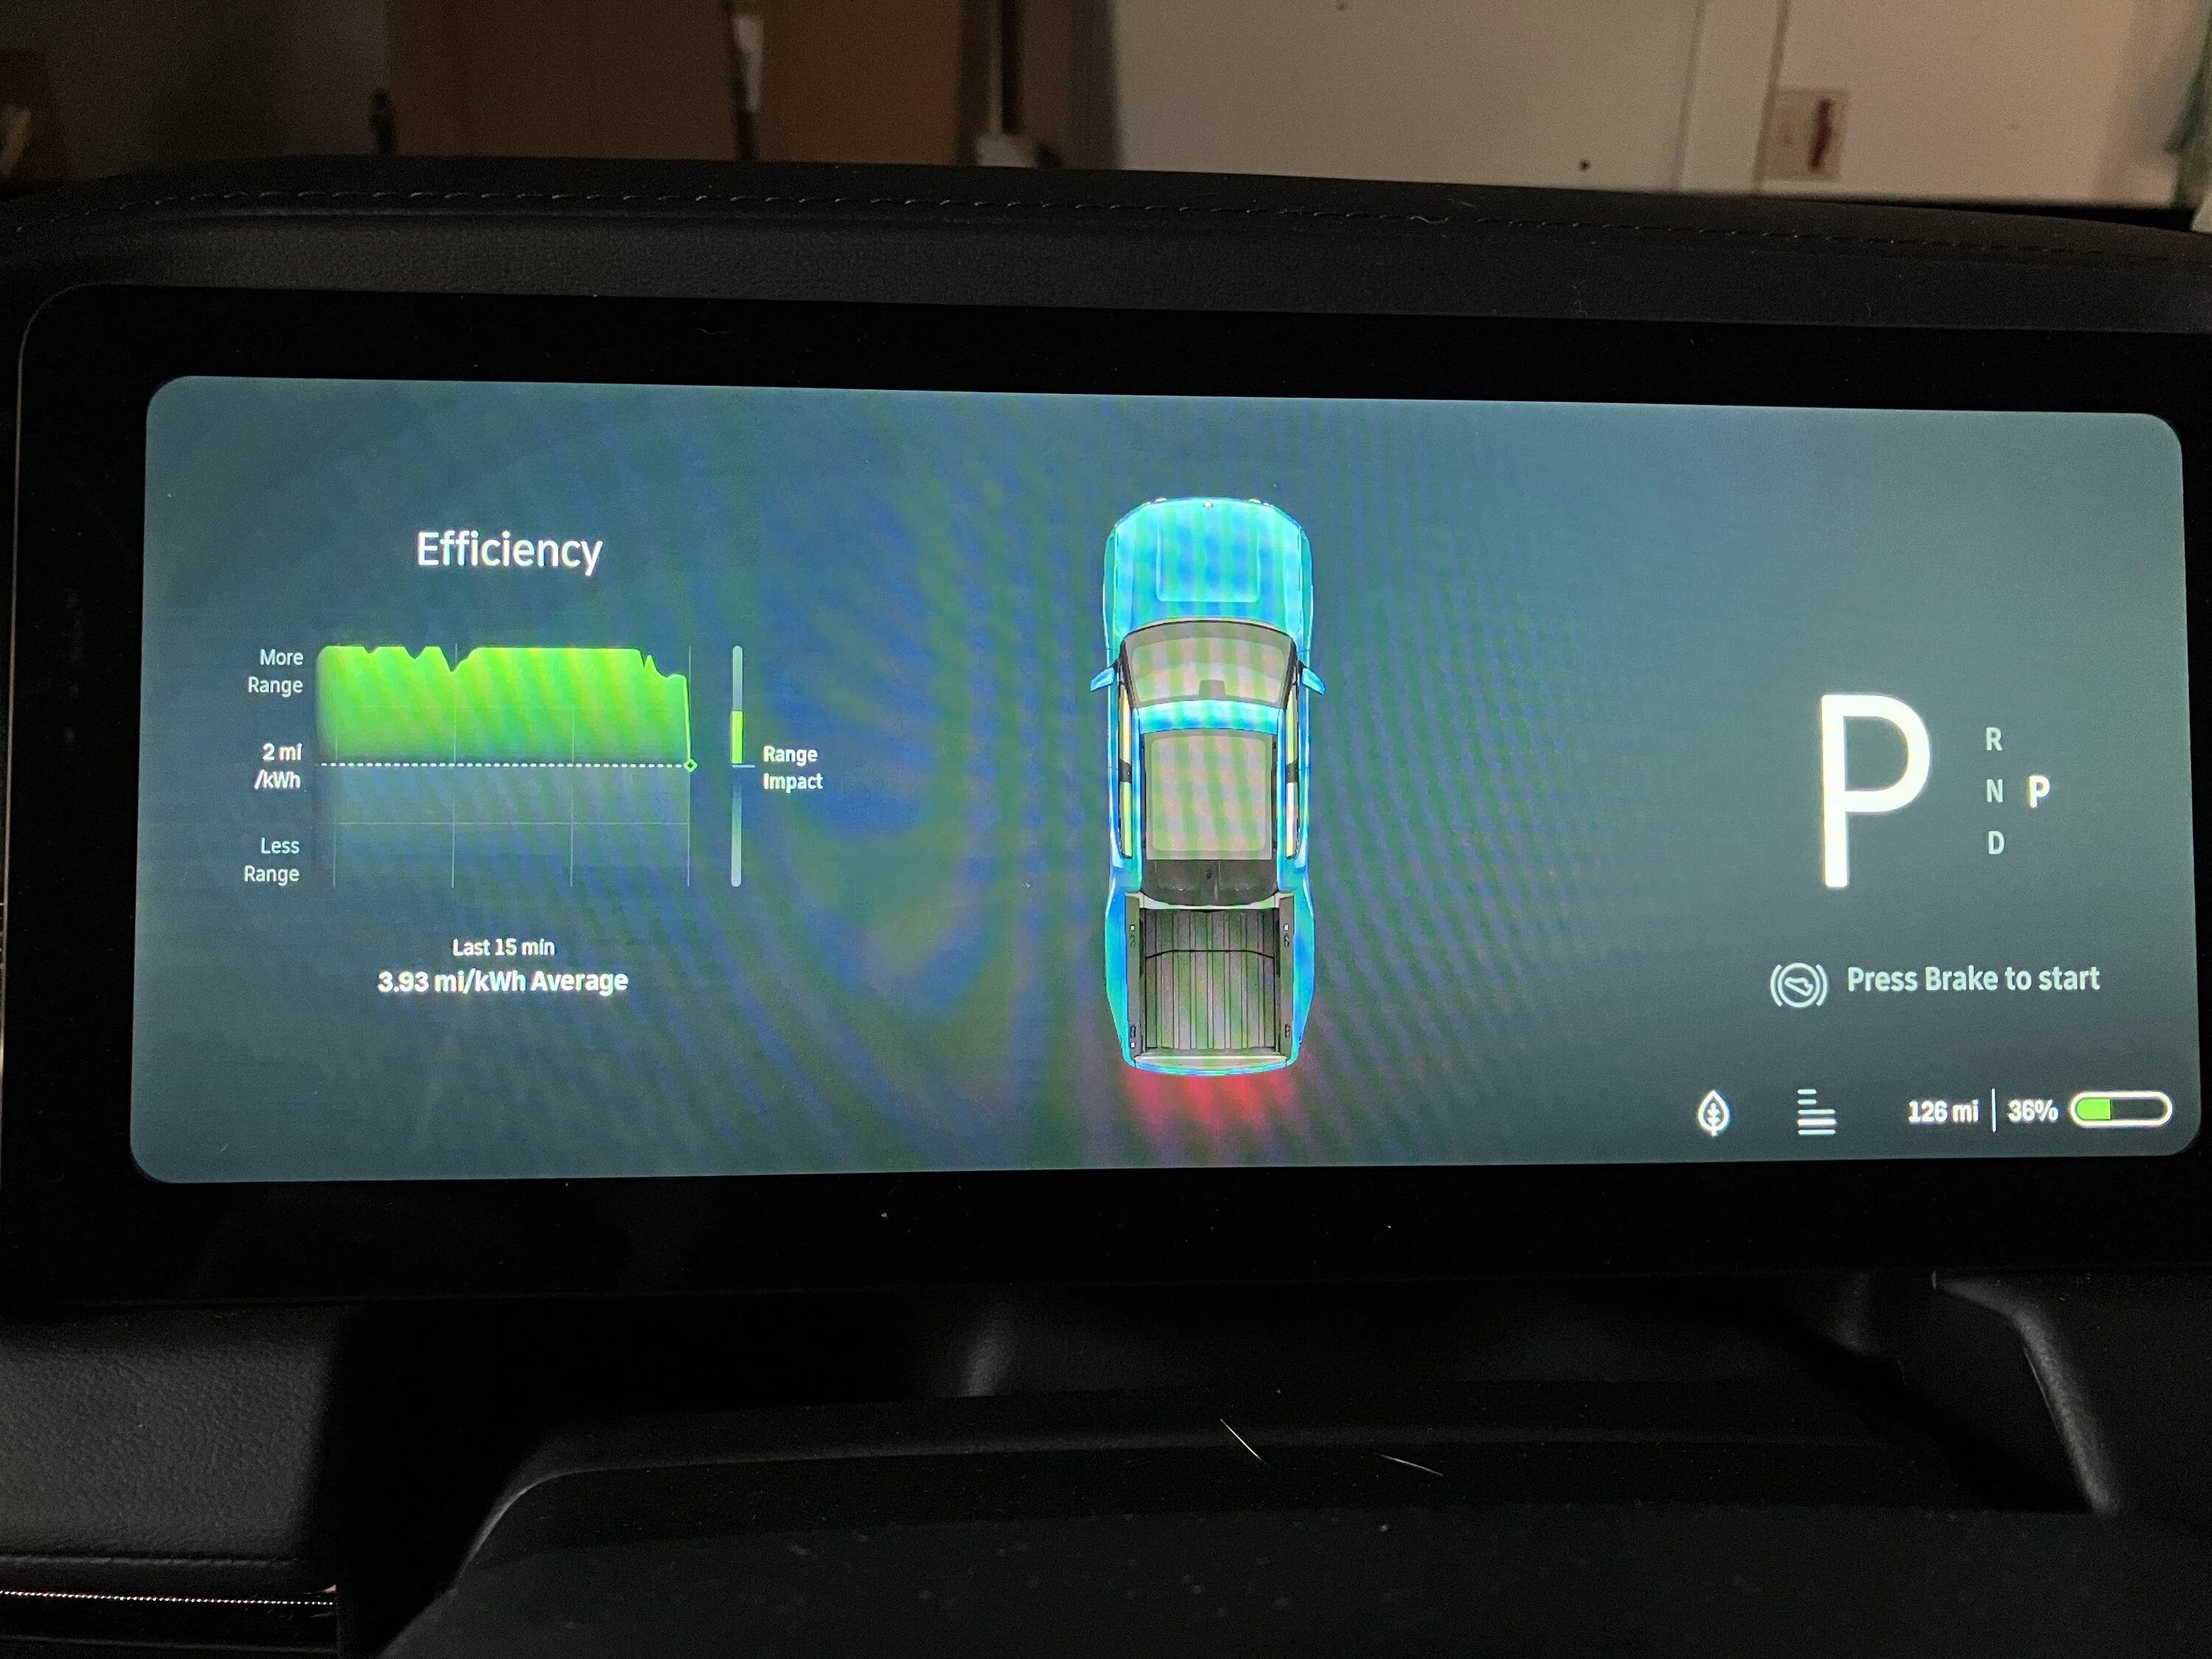
I don’t know if it’s above the rating of the inverter or just that 4mi/kWh is so much higher than will usually be seen by drivers that it was decided to end the display scale there.Thank you Thedude. That is what I thought. In the PV industry we called this clipping, as when the module output was above the inverter rating.
Sponsored
goldburger
Well-Known Member
- Joined
- Feb 5, 2022
- Threads
- 18
- Messages
- 1,730
- Reaction score
- 2,038
- Location
- Los Angeles
- Vehicles
- 2022 R1T
4.01 is actually the highest I’ve seen it go…
Last edited:
davidrbailey
Member
- First Name
- David
- Joined
- Sep 28, 2022
- Threads
- 2
- Messages
- 8
- Reaction score
- 23
- Location
- Palo Alto, CA
- Vehicles
- R1S
"4.01" is the highest average I've seen displayed, pretty frequently actually when I peg it for the whole 15 mins coming down out of the Sierra Nevada mountains.
The software engineer responsible for the rounding should've cleaned up that not-so-uncommon edge case!
Of course your real rate can be much higher than this and you can see it unclipped using the trip meter. I see > 10 mi/kwh there on a good downhill run where the battery percentage doesn't hardly drop at all. I haven't tried using the trip meter specifically on the steepest sections where regen manages to increase the state of charge over a several-mile section to see how it handles that ;*)
Last edited:
W1SE
Well-Known Member
- First Name
- Jake
- Joined
- Nov 28, 2021
- Threads
- 52
- Messages
- 556
- Reaction score
- 1,243
- Location
- Vancouver, WA
- Vehicles
- 2022 R1T Quad, 2024 R1S Max
- Occupation
- Branch manager
You can actually gain miles on a long and steep downhill stint. So this wouldn’t be displayable.
the system is not “clipping” (like a person putting Enphase IQ8+ micro inverter on a current 400w PV module.) but rather it just displayed at 4.0 to give it some kinda of top.
A note of digressing: the solar comparison is for OP or any other PV person as I am a solar guy also. I am not a fan of Enphase for continuing to manufacture and promote that IQ8+ garbage. They are the main reason for PV clipping as a common thing
Zoidz
Well-Known Member
I see this every day since I live at the top of a mountain in a rural area. The software we use in manufacturing systems provides dynamic scaling of graphs. Rivian could certainly do this. When the graph hits peak, rescale the Y axis by half.
140 degrees
Well-Known Member
- Joined
- Mar 14, 2022
- Threads
- 15
- Messages
- 153
- Reaction score
- 315
- Location
- Auburn, CA
- Vehicles
- BMW i3, Rivian R1T
I think the usability of the graph is pretty good as is. If the scale was changing, I'd be taking my eyes off the road trying to decipher. What I'd like to see is the option to change the length of the 15min average. On my i3, it can display instantaneous or the average consumption since being reset.
When I'm judging the effect of highway speed, I like to refer to the instantaneous consumption. It is useful if I'm a little worried about making it to the next charger.
When I'm judging the effect of highway speed, I like to refer to the instantaneous consumption. It is useful if I'm a little worried about making it to the next charger.
Sponsored
rydb
Well-Known Member
- First Name
- Ryan
- Joined
- Jan 29, 2020
- Threads
- 5
- Messages
- 109
- Reaction score
- 146
- Location
- Tallahassee, FL
- Vehicles
- 2022 R1T LE
It should show the right average regardless of the display itself clipping, which I’m fine with. Having it peg the number at 4 just because that’s the scale of the graph is poor programming.
OP
OP
PVguy
Well-Known Member
- Thread starter
- #12
Thank you for all of the replies. I am fairly satisfied with the current graphing display. Perhaps some improvements will be forthcoming.It should show the right average regardless of the display itself clipping, which I’m fine with. Having it peg the number at 4 just because that’s the scale of the graph is poor programming.
VSG
Well-Known Member
The graph is showing miles traveled per kWh used
When rolling downhill, you're traveling some distance d while expending no energy so the graph would need to display a value of d/0, which is infinity. This also occurs during regenerative braking - you're going some distance without expending energy.
No amount of dynamic rescaling will fix this because these extremely large spikes will dominate the graph and make normal driving look like a flat line in comparison.
Clipping the graph at some level is a reasonable way to keep the displayed information useful.
Sponsored
Similar threads
- Replies
- 12
- Views
- 1,226