usofrob
Well-Known Member
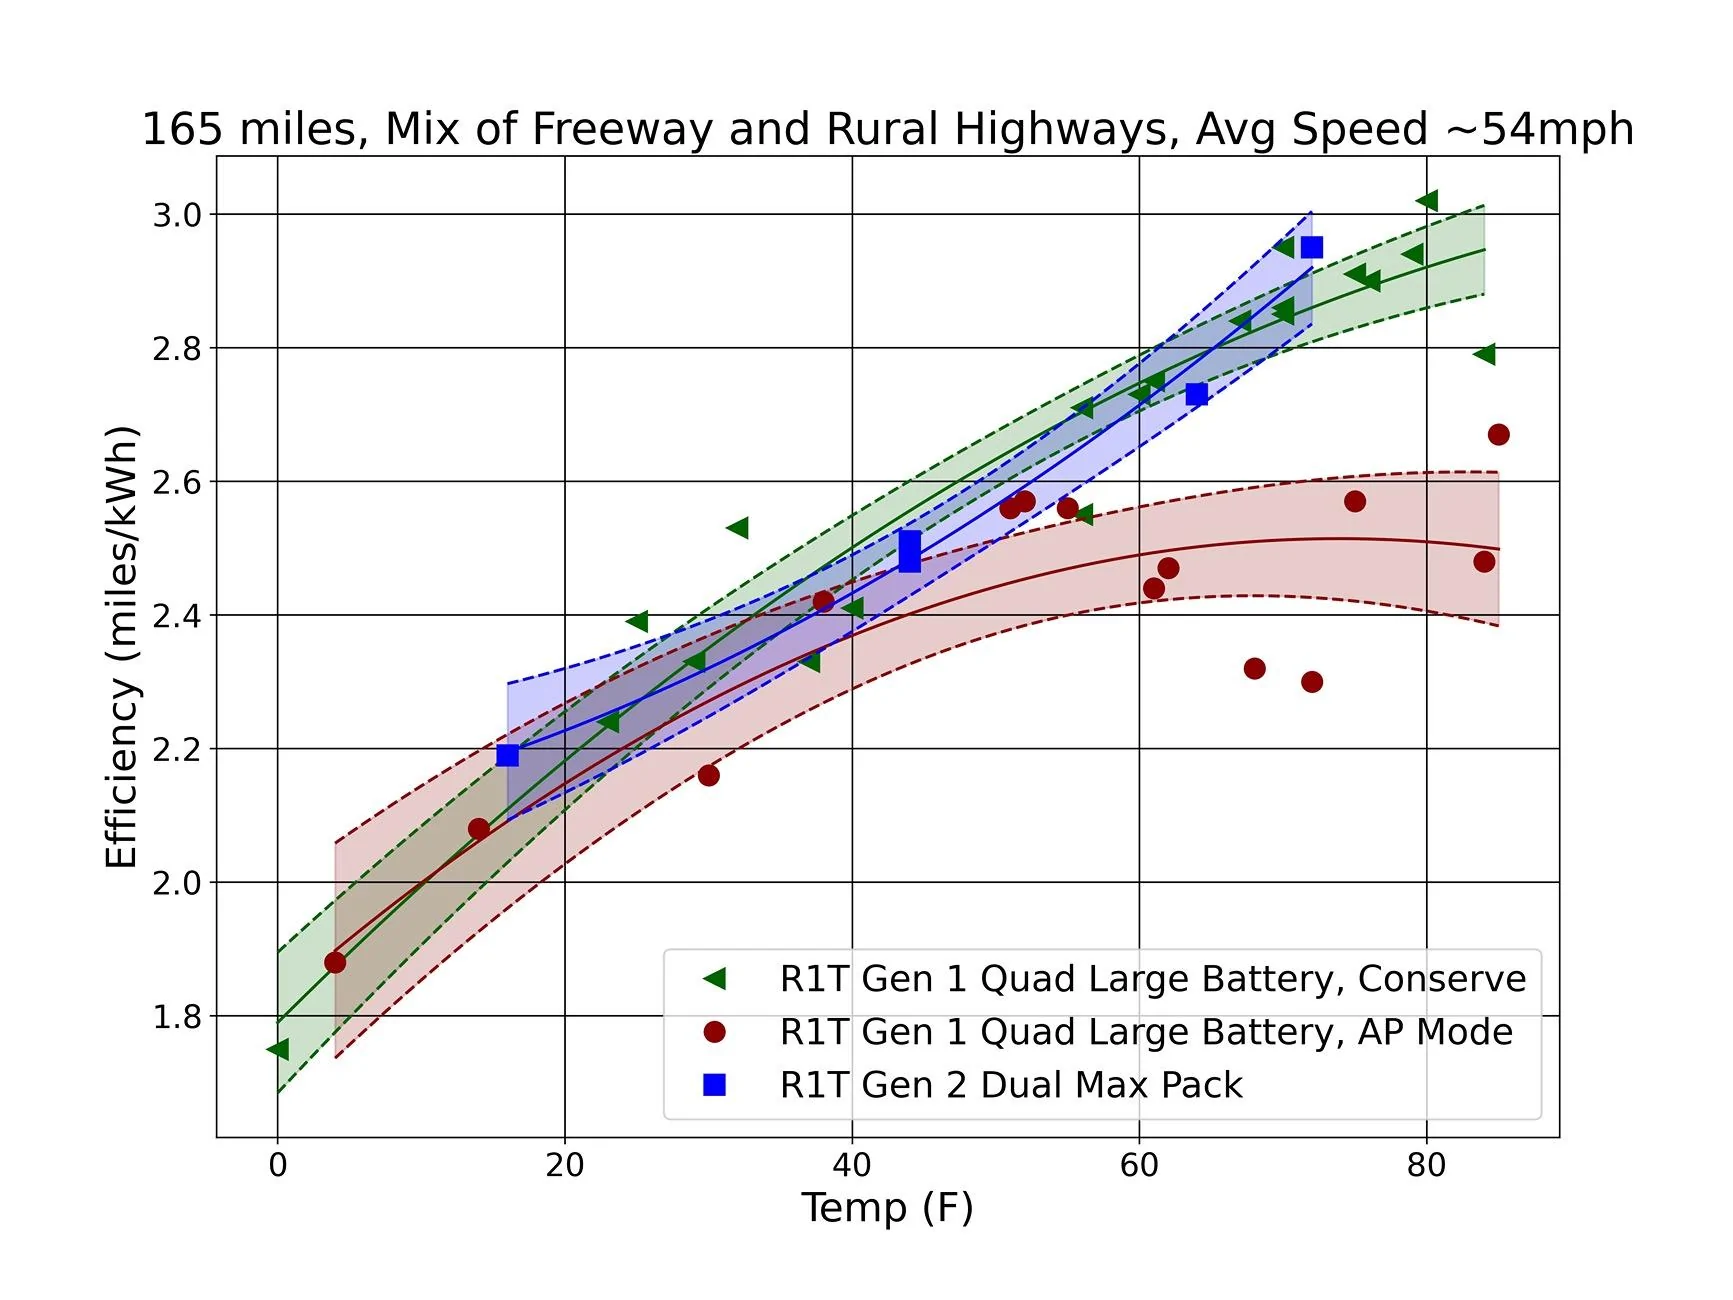
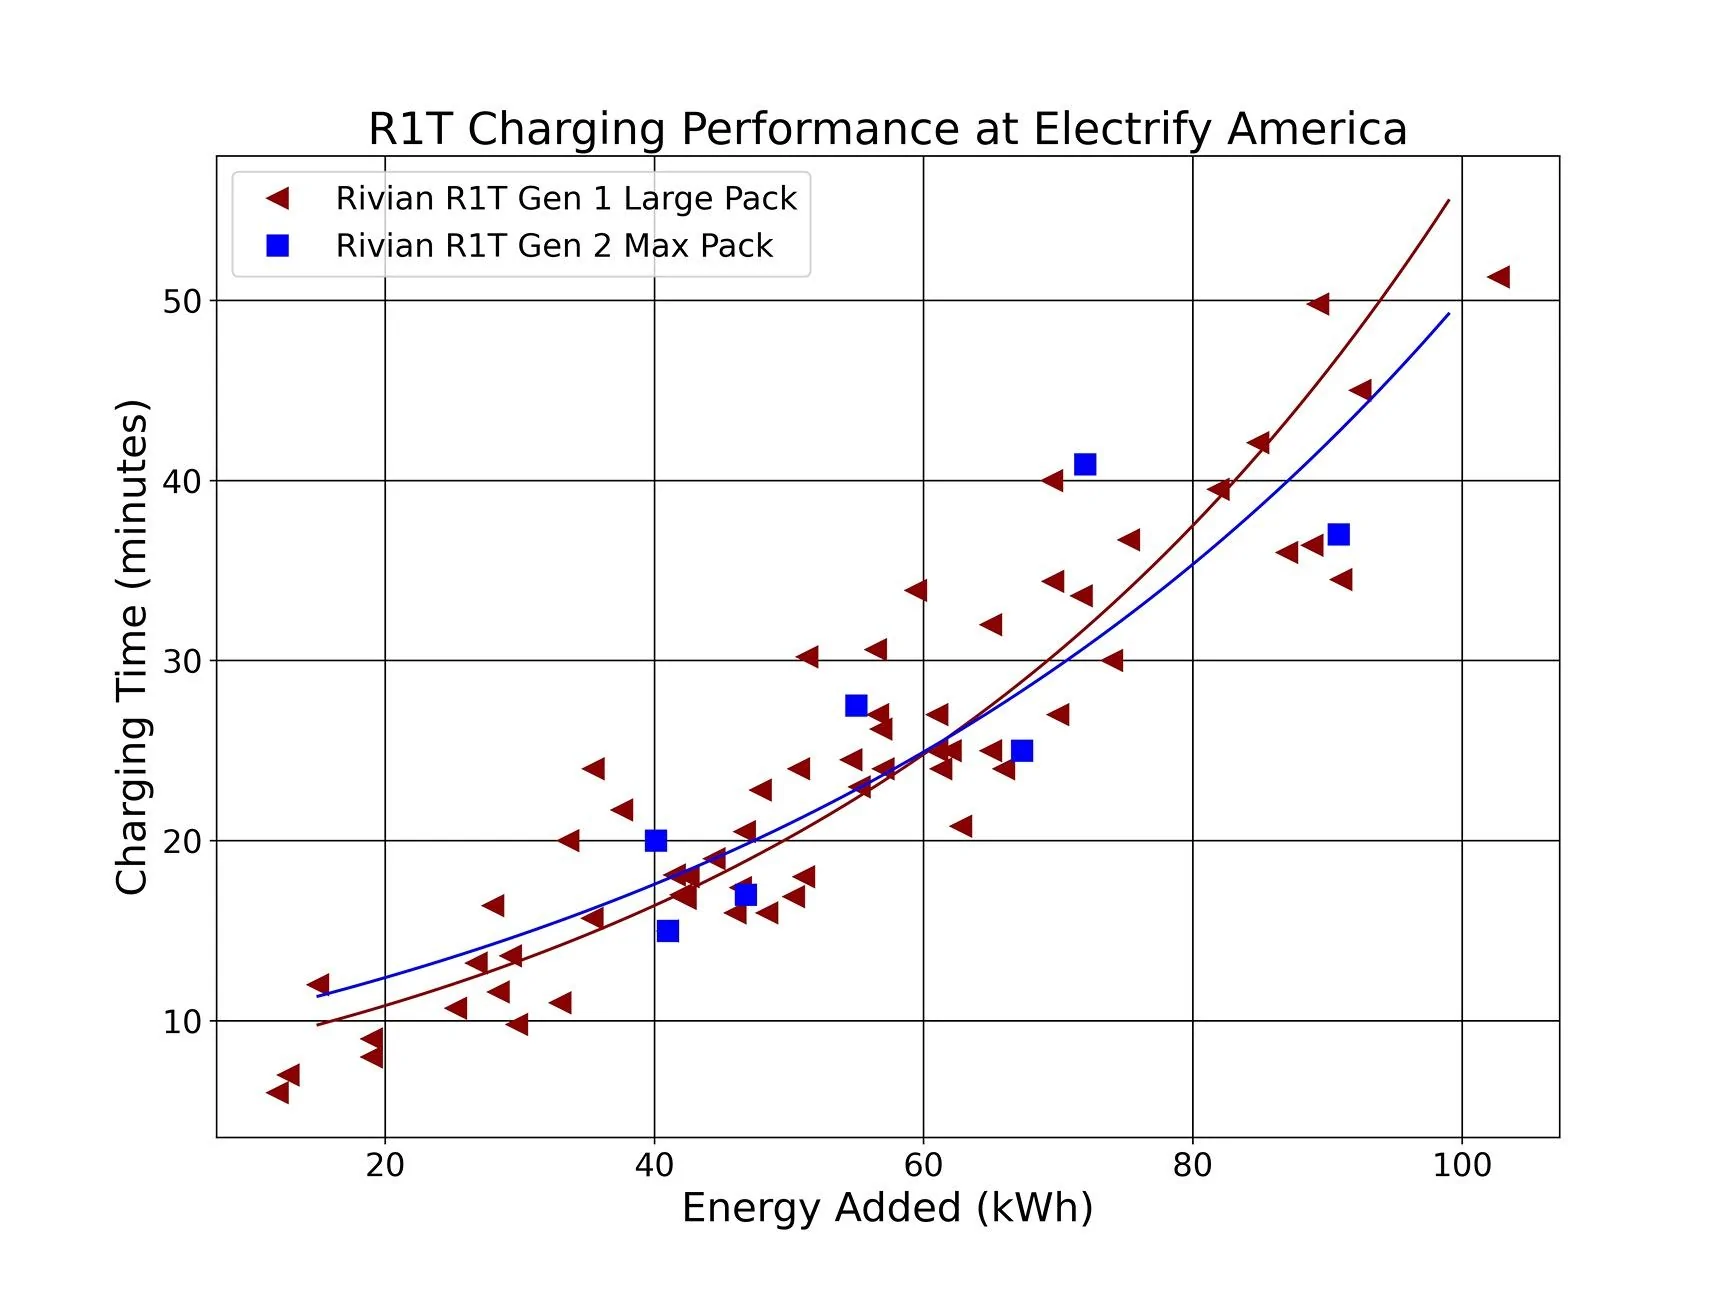
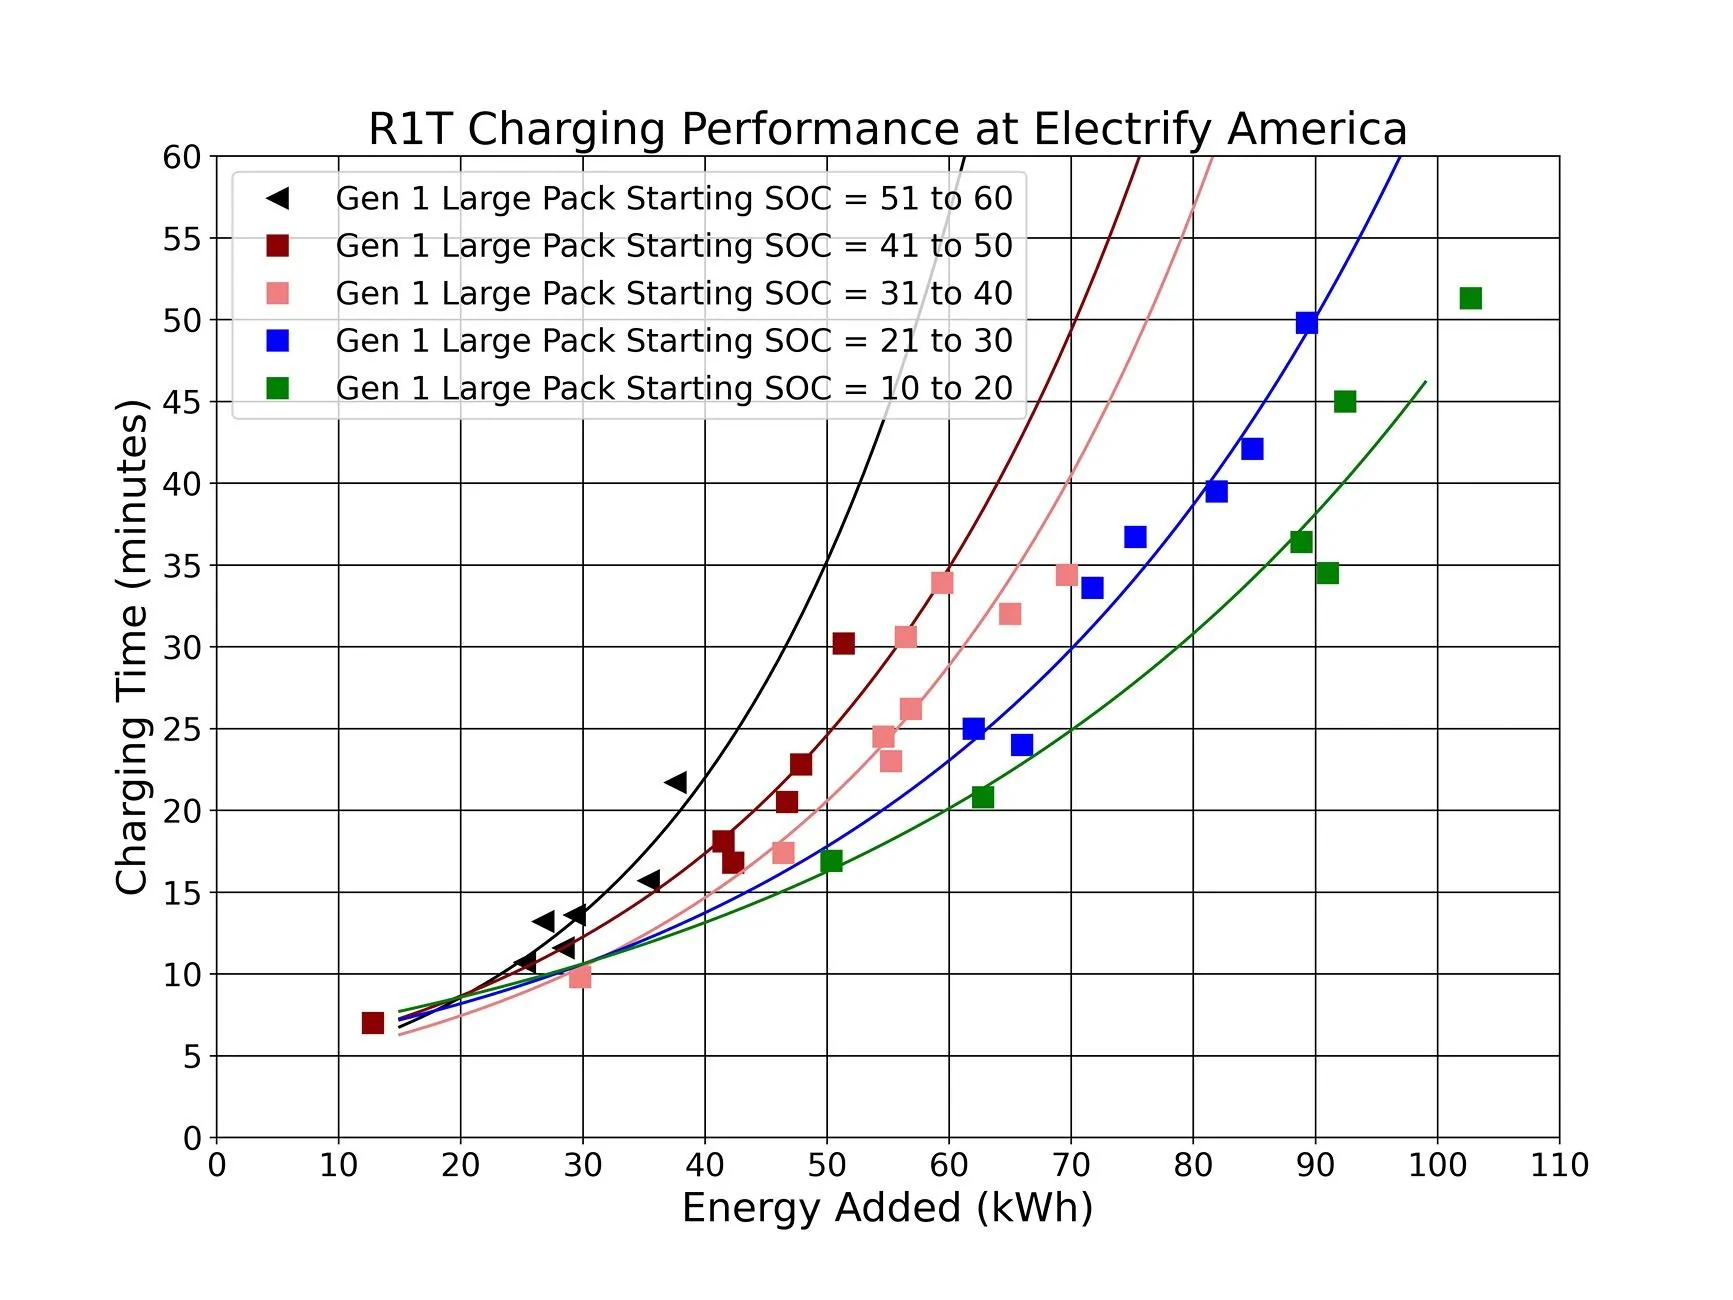
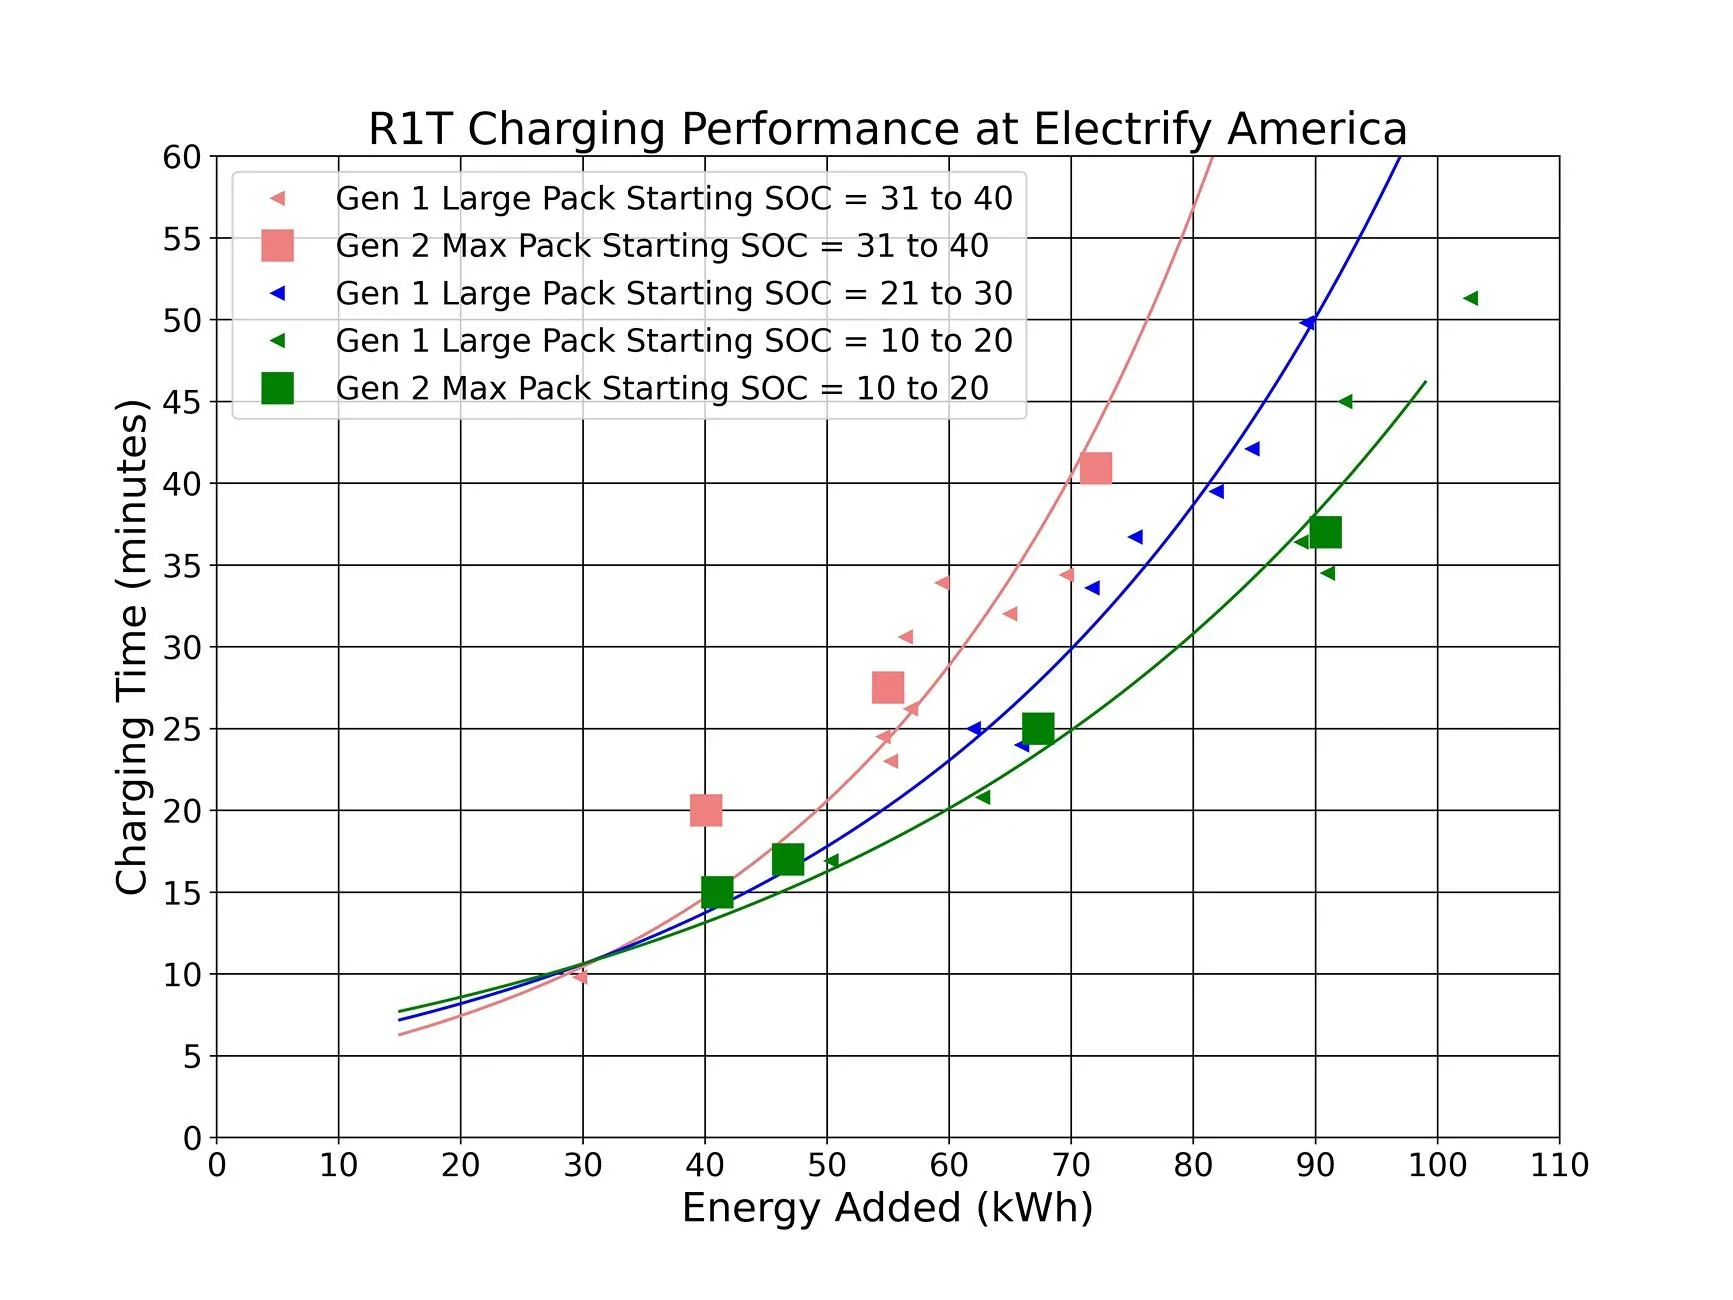
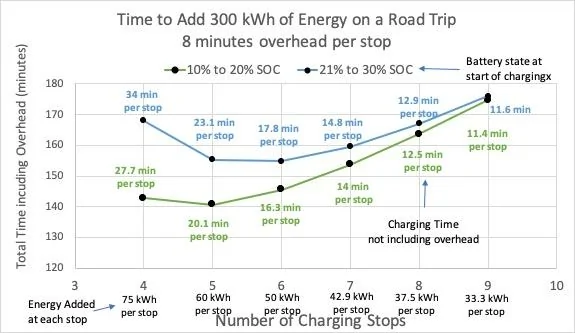
Wait, what? Kyle was saying it was a major fail because he only got 80% of ideal? UghThe "10% challenge" video" you referenced above showed adding 42.5 kWh in 15 min (horrible charging according to "Out of Spite Kyle" @moosehead).
Under "ideal" circumstances with no "de-rating", we should expect to add around 50-52 kWh of energy (200+ kW, if we start from 10-20% SOC).

Sponsored