
Sponsored

mkhuffman

Well-Known Member
First Name
Mike
Joined
Nov 9, 2020
Threads
14
Messages
3,072
Reaction score
3,524
Location
Virginia
Vehicles
2025 R1T Tri-Max, Jeep GC-L, VW Jetta
Last edited:
OP
OP
ksurfier

ksurfier

Well-Known Member
First Name
Ken
Joined
Aug 23, 2022
Threads
54
Messages
1,201
Reaction score
1,140
Location
CA
Vehicles
R1S, Tesla
Occupation
Fake Science Lead
Clubs
 
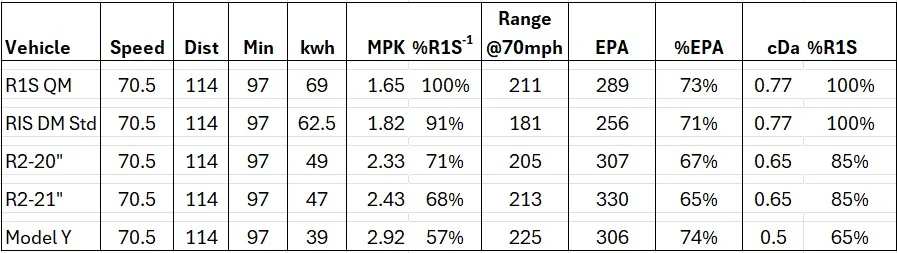
Where does that data come from, how does it mean anything when you don't provide any context?
At 70 mph, aerodynamic drag is one of the largest energy demands, so CdA does a surprisingly good job of predicting the relative highway efficiency of the Model Y, R2 and R1S.

As CdA increases, miles per kWh generally decreases. For example, the R2 has about 32% more CdA than the Model Y, so it must use substantially more energy to push air at the same speed. The R2 also has about 13% less CdA than the R1S, helping explain why it should be more efficient.

To make a meaningful comparison, however, the vehicles must be evaluated under similar conditions. Speed, elevation, temperature, wind, road grade, tires, climate-control use and vehicle load can all materially affect efficiency. Ideally, comparisons should be normalized to the same speed, temperature, elevation and still-air conditions so that differences in mi/kWh are more likely to reflect the vehicles themselves rather than the test environment.

 

mkhuffman

Well-Known Member
First Name
Mike
Joined
Nov 9, 2020
Threads
14
Messages
3,072
Reaction score
3,524
Location
Virginia
Vehicles
2025 R1T Tri-Max, Jeep GC-L, VW Jetta
At 70 mph, aerodynamic drag is one of the largest energy demands, so CdA does a surprisingly good job of predicting the relative highway efficiency of the Model Y, R2 and R1S.

As CdA increases, miles per kWh generally decreases. For example, the R2 has about 32% more CdA than the Model Y, so it must use substantially more energy to push air at the same speed. The R2 also has about 13% less CdA than the R1S, helping explain why it should be more efficient.

To make a meaningful comparison, however, the vehicles must be evaluated under similar conditions. Speed, elevation, temperature, wind, road grade, tires, climate-control use and vehicle load can all materially affect efficiency. Ideally, comparisons should be normalized to the same speed, temperature, elevation and still-air conditions so that differences in mi/kWh are more likely to reflect the vehicles themselves rather than the test environment.
Thank you, AI bot. But you didn't answer my question.
 

ohmman

Well-Known Member
First Name
Mark
Joined
Aug 22, 2020
Threads
4
Messages
112
Reaction score
325
Location
Sonoma, California
Vehicles
2022 Model Y, 2024 Model Y, 2022 Model 3
FWIW, my 2022 Model Y with 76k miles on it, the majority of which are going between my home in Sonoma (220ft above sea level) and Truckee, CA (6545ft above sea level) with LOTS of snow/cold driving, has averaged 265Wh/mi or 3.77mi/kWh. I certainly don't expect the same performance from my R2 but I disagree overall with suggestions that the MY gets 3mi/kWh at 70mph in ideal conditions. I drive on I-80 with everyone else, meaning I'm going 79-84mph most of the time.

I understand this is an aggregate number, but I can run an analysis on my next roundtrip up/back and see where I land.
 

Sponsored

OP
OP
ksurfier

ksurfier

Well-Known Member
First Name
Ken
Joined
Aug 23, 2022
Threads
54
Messages
1,201
Reaction score
1,140
Location
CA
Vehicles
R1S, Tesla
Occupation
Fake Science Lead
Clubs
 
OOS just posted new MY Perf 10% challenge.

It got 3.3 mpk at 80mph.
That 3.3 mi/kWh at 80 mph reinforces the key difference the EPA numbers miss. At lower highway speeds, the R2 and Model Y may have similar usable 10–70% road-trip range, but the Model Y holds its efficiency much better as speed rises (~30% lower drag than R2).

Model Y Performance would still provide at least 130 miles between 10% and 70%, while the R2 may be closer to 100 (or less) miles. The additional high-speed range can affect charger selection, stop frequency, and overall trip time; especially on routes with wider charger spacing.
 

Apprunner

Well-Known Member
Joined
Mar 17, 2026
Threads
0
Messages
68
Reaction score
78
Location
So-cal
Vehicles
Tesla M3P
OOS just posted new MY Perf 10% challenge.

It got 3.3 mpk at 80mph.
Yeah...not surprising. I was hoping R2 would have more mileage than my Model 3 given its bigger battery but the boxy shape will probably be noticeably less for roadtrips. 70mph is not practical for California road trips so the 80mph is a much better indicator. I'm hoping the R2 gets at least 2.7 mpk then at least its getting near 150 miles of range for a 10-70% charge.
 
OP
OP
ksurfier

ksurfier

Well-Known Member
First Name
Ken
Joined
Aug 23, 2022
Threads
54
Messages
1,201
Reaction score
1,140
Location
CA
Vehicles
R1S, Tesla
Occupation
Fake Science Lead
Clubs
 
Look forward to seeing your results...here's a general idea of what you might expect to see...pretty steep drop off from 63 mph to 82 mph:
MPKRangeSpeed
3.631557.0
3.430060.0
3.329063.0
3.127566.5
3.026467.0
2.925170.0
2.825071.0
2.723874.0
2.622576.5
2.421279.0
2.320082.0
 

Sponsored

mkhuffman

Well-Known Member
First Name
Mike
Joined
Nov 9, 2020
Threads
14
Messages
3,072
Reaction score
3,524
Location
Virginia
Vehicles
2025 R1T Tri-Max, Jeep GC-L, VW Jetta
Look forward to seeing your results...here's a general idea of what you might expect to see...pretty steep drop off from 63 mph to 82 mph:
MPKRangeSpeed3.631557.03.430060.03.329063.03.127566.53.026467.02.925170.02.825071.02.723874.02.622576.52.421279.02.320082.0
The efficiency of the R2 is 2.6 mi/kWh at 79 mph.
 
OP
OP
ksurfier

ksurfier

Well-Known Member
First Name
Ken
Joined
Aug 23, 2022
Threads
54
Messages
1,201
Reaction score
1,140
Location
CA
Vehicles
R1S, Tesla
Occupation
Fake Science Lead
Clubs
 
The efficiency of the R2 is 2.6 mi/kWh at 79 mph.
I was seeing less than 2.0 MPK on my own highway test drive, so I have a hard time believing 2.6 MPK at 79 mph in still air is realistic. Even allowing for heavy A/C use, climate control would not explain a 0.6 mi/kWh difference by itself. The only first-hand report near 2.6 MPK also benefited from a 5–10 mph tailwind, so it does not support using 2.6 mi/kWh as a normalized 79 mph benchmark.
 

Indy avocado

Well-Known Member
First Name
Greg
Joined
Dec 17, 2022
Threads
3
Messages
240
Reaction score
330
Location
Indiana
Vehicles
'22 R1T, '17 Macan S, '11 Mustang GT
That 3.3 mi/kWh at 80 mph reinforces the key difference the EPA numbers miss. At lower highway speeds, the R2 and Model Y may have similar usable 10–70% road-trip range, but the Model Y holds its efficiency much better as speed rises (~30% lower drag than R2).

Model Y Performance would still provide at least 130 miles between 10% and 70%, while the R2 may be closer to 100 (or less) miles. The additional high-speed range can affect charger selection, stop frequency, and overall trip time; especially on routes with wider charger spacing.
Look forward to seeing your results...here's a general idea of what you might expect to see...pretty steep drop off from 63 mph to 82 mph:
MPKRangeSpeed
3.631557.0
3.430060.0
3.329063.0
3.127566.5
3.026467.0
2.925170.0
2.825071.0
2.723874.0
2.622576.5
2.421279.0
2.320082.0

Not wrong that Model Y Performance punches above EPA here.

I have no way to prove or disprove this table of speeds and ranges. 70mph looks reasonable. Would be nice if you shared method and sources.

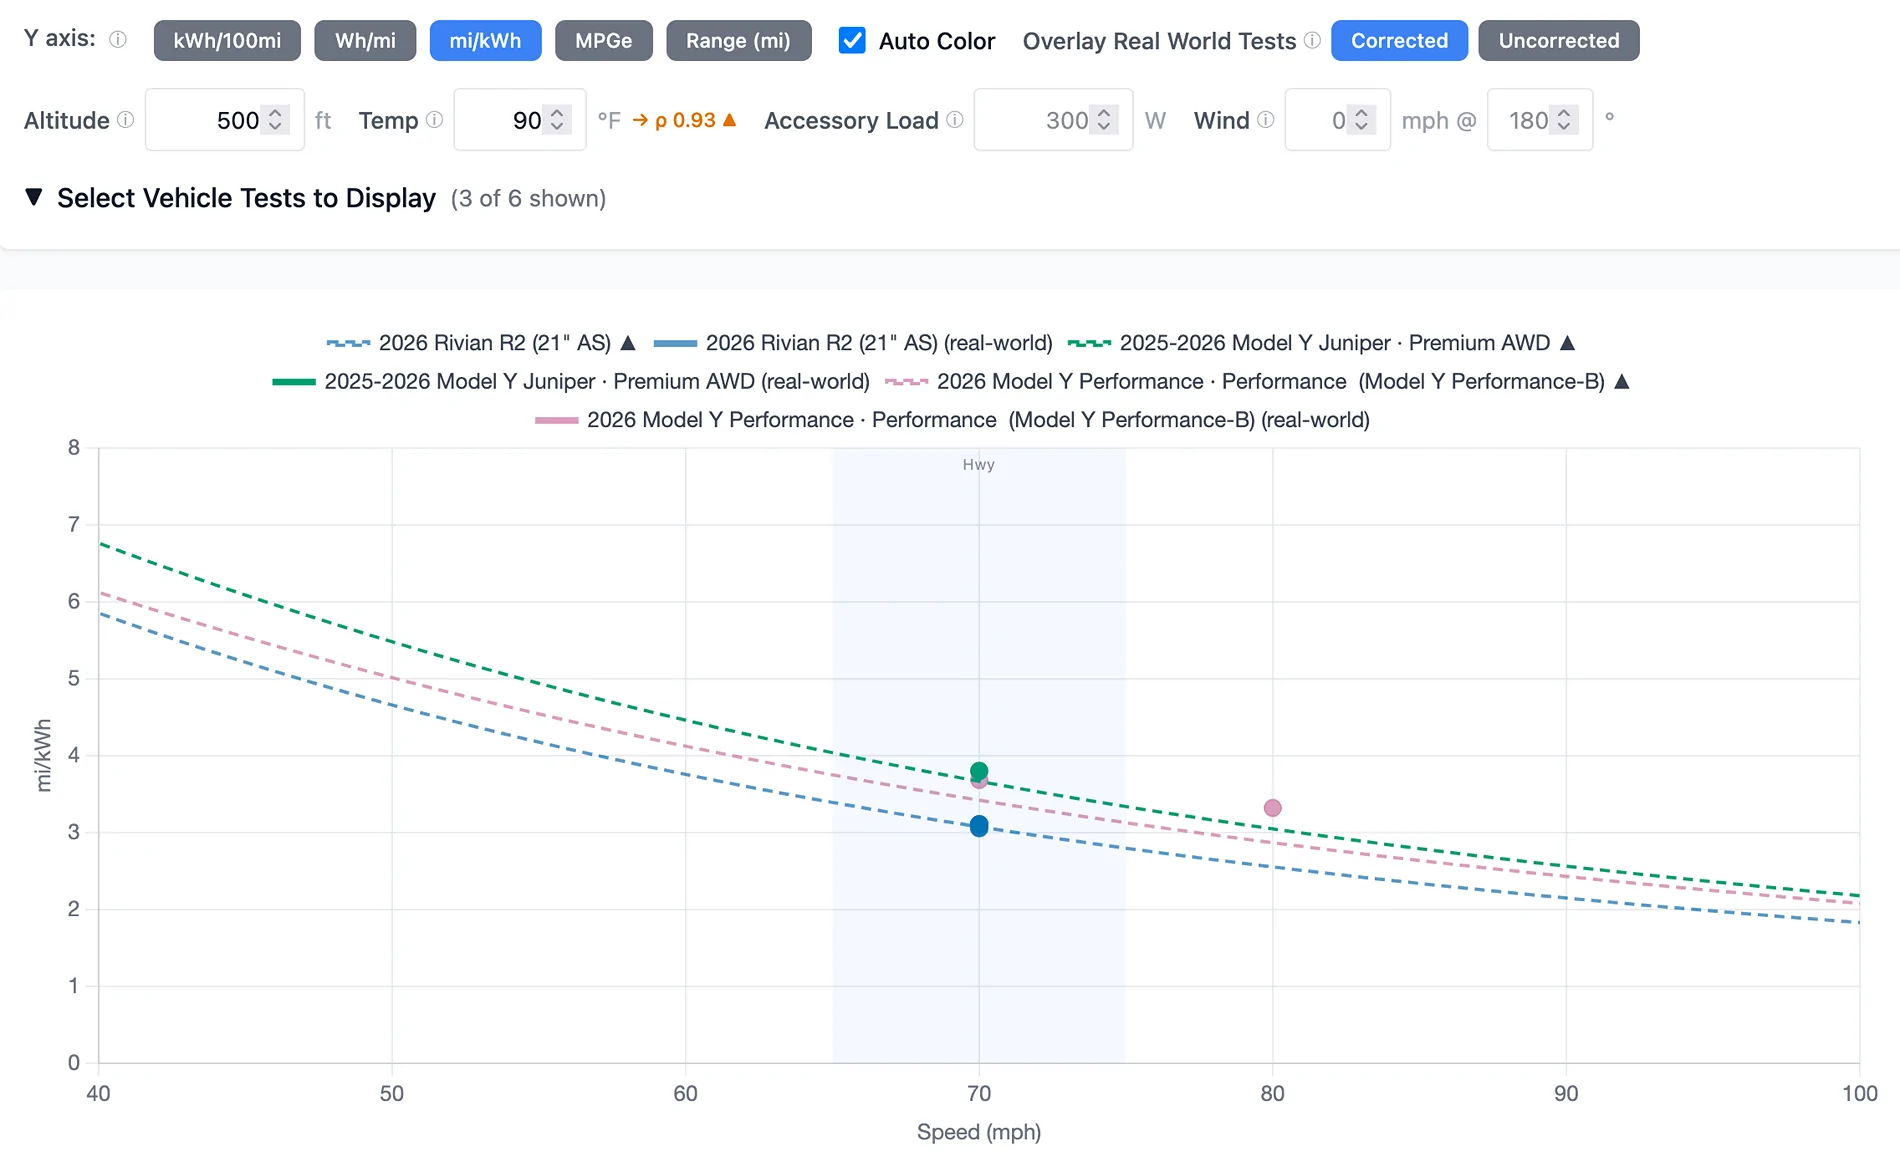
I just added the 10% challenge data to my calculator and added some additional corrections and features. Both Model Y performance range tests I have punch above the expected performance. R2 and Model Y Premium hit their marks.

Rivian R1T R1S R2 Highway Efficiency Test: 80 MPH vs 70 MPH Changed Everything 1784790638524-zc
 

BigE

Well-Known Member
First Name
Eric
Joined
Nov 19, 2020
Threads
41
Messages
840
Reaction score
1,403
Location
North Carolina
Vehicles
Rivian R1T, Honda S2000
When explaining mileage and range to our non-EV friends, it often helps to put things in ICE vehicle terms.

Example: depending on which R2 variant you end up with, an 88 kWh usable pack ÷ 33.7 kWh of energy per gallon of gasoline ≈ 2.6 gallons of fuel in an R2. My R1T Max pack is roughly 4.2 gallons equivalent.

My point is, when you look at how few gallons of “fuel” you actually have, it becomes much more apparent why wind, temperature, speed, etc. have such a noticeable impact on range. Those factors eat a much bigger percentage of a 3-gallon tank than they do of a 15–20 gallon tank.
 

mkhuffman

Well-Known Member
First Name
Mike
Joined
Nov 9, 2020
Threads
14
Messages
3,072
Reaction score
3,524
Location
Virginia
Vehicles
2025 R1T Tri-Max, Jeep GC-L, VW Jetta
... Would be nice if you shared method and sources.
His method and sources are the same as mine: wild ass guess, not taking into account anything other than speed.
Sponsored


Top