Budman
Well-Known Member
- Thread starter
- #1
This is a follow-up to a post I did in May of 2024 when my R1T had 42,000 miles on it.
https://www.rivianforums.com/forum/...dation-2022-r1t-quad-motor.27821/#post-538633
I now have 54,000 miles on the R1T and I repeated the test using the same procedure;
1. Fill battery to 100%
2. Drive on a mix of rural roads at 55 - 60 mph and Interstate at 70 to 75 mph
3. Record the energy used and miles driven at each 5% of battery state of charge increment as reported on the main UI screen in the vehicle
4. Stop test at 9% state of charge. Then extrapolate results to 0% state of charge
5. Fill battery from 9% to 100% and record energy put into the battery. Then extrapolate the results to estimate energy needed to go from 0% to 100%.
This gives two estimates of the 100% capacity of the battery. One estimates how much was used, the other estimates how. much put back in. I did not want to drain my battery to 0% so I'm doing linear extrapolations to the full battery estimate. The results are very linear from 100% to 10% but the behavior COULD be non-linear in the last 10% so this is just an estimate of the true capacity.
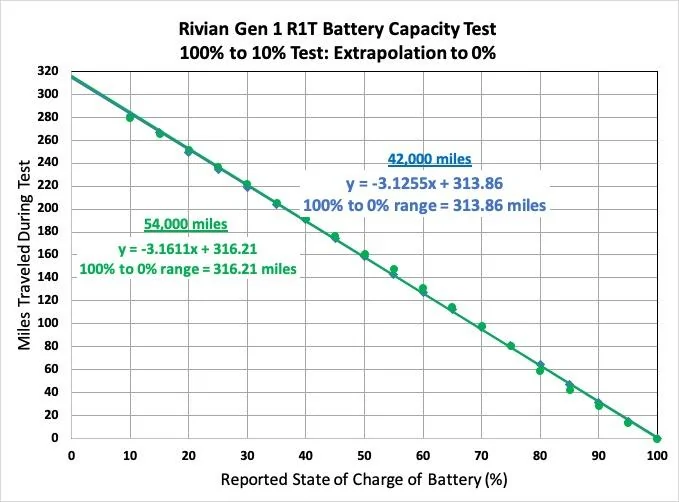
Estimate 1: Energy used while driving from 100% state of charge to 10% state of charge.

Data taken at every 5% SOC. Full capacity of battery is estimated by where the linear fit to the data crosses the 0% SOC mark.
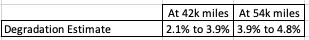
At 42,000 miles: ~3.9% degradation
At 54,000 miles ~4.8% degradation
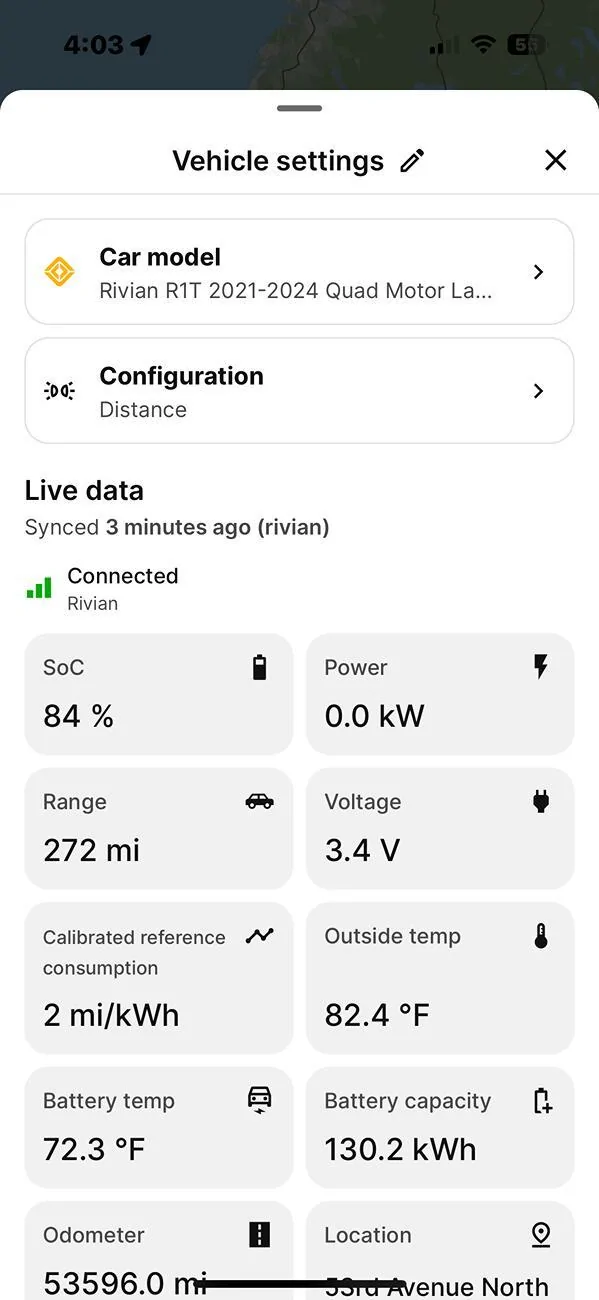
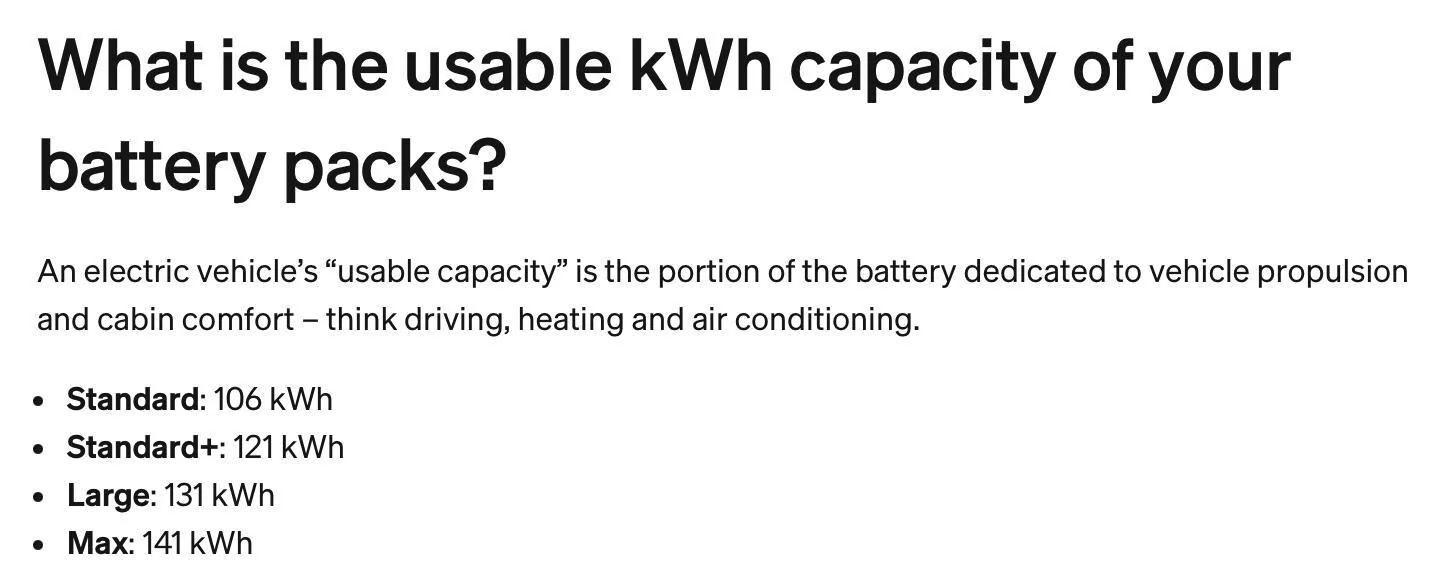
assuming the original capacity was 131 kWh as reported elsewhere
The Rivian warranty covers the battery to 70% of original capacity at 150,000 miles (30% degradation)
Estimate 2: Energy put back into battery to go from 9% to 100%. The battery reading when I stopped the test both times was 9% so I had to put 91% back in..

Using this method the degradation estimates are.
At 42,000 miles: ~2.1% degradation
At 54,000 miles ~3.9% degradation
BATTERY DEGRADATION ESTIMATES;

For reference, here is the chart shown miles driven during the test and the estimated full pack range. This is for reference only, environmental conditions, traffic, driving speeds were not the same between the two test so don't read too much into the differences between them. But, ~315 miles of full pack range was seen each time and this agreed very closely with the range estimate given by the vehicle when I started driving at 100% state of charge. This was on a mix of 60 mph and 70 mph speed limit roads.
https://www.rivianforums.com/forum/...dation-2022-r1t-quad-motor.27821/#post-538633
I now have 54,000 miles on the R1T and I repeated the test using the same procedure;
1. Fill battery to 100%
2. Drive on a mix of rural roads at 55 - 60 mph and Interstate at 70 to 75 mph
3. Record the energy used and miles driven at each 5% of battery state of charge increment as reported on the main UI screen in the vehicle
4. Stop test at 9% state of charge. Then extrapolate results to 0% state of charge
5. Fill battery from 9% to 100% and record energy put into the battery. Then extrapolate the results to estimate energy needed to go from 0% to 100%.
This gives two estimates of the 100% capacity of the battery. One estimates how much was used, the other estimates how. much put back in. I did not want to drain my battery to 0% so I'm doing linear extrapolations to the full battery estimate. The results are very linear from 100% to 10% but the behavior COULD be non-linear in the last 10% so this is just an estimate of the true capacity.
Estimate 1: Energy used while driving from 100% state of charge to 10% state of charge.
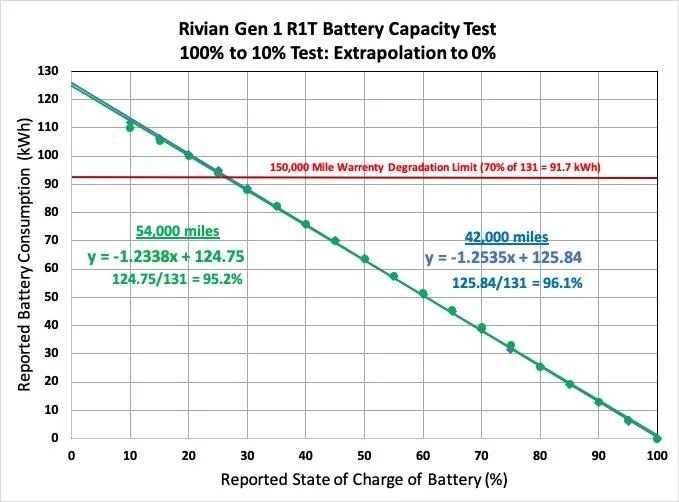
Data taken at every 5% SOC. Full capacity of battery is estimated by where the linear fit to the data crosses the 0% SOC mark.
At 42,000 miles: ~3.9% degradation
At 54,000 miles ~4.8% degradation
assuming the original capacity was 131 kWh as reported elsewhere
The Rivian warranty covers the battery to 70% of original capacity at 150,000 miles (30% degradation)
Estimate 2: Energy put back into battery to go from 9% to 100%. The battery reading when I stopped the test both times was 9% so I had to put 91% back in..
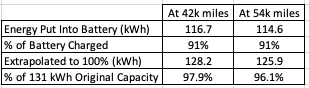
Using this method the degradation estimates are.
At 42,000 miles: ~2.1% degradation
At 54,000 miles ~3.9% degradation
BATTERY DEGRADATION ESTIMATES;
For reference, here is the chart shown miles driven during the test and the estimated full pack range. This is for reference only, environmental conditions, traffic, driving speeds were not the same between the two test so don't read too much into the differences between them. But, ~315 miles of full pack range was seen each time and this agreed very closely with the range estimate given by the vehicle when I started driving at 100% state of charge. This was on a mix of 60 mph and 70 mph speed limit roads.
Sponsored