tivoboy
Well-Known Member
- First Name
- Paul
- Joined
- Nov 8, 2025
- Threads
- 2
- Messages
- 179
- Reaction score
- 182
- Location
- Palo Alto, CA
- Vehicles
- M3
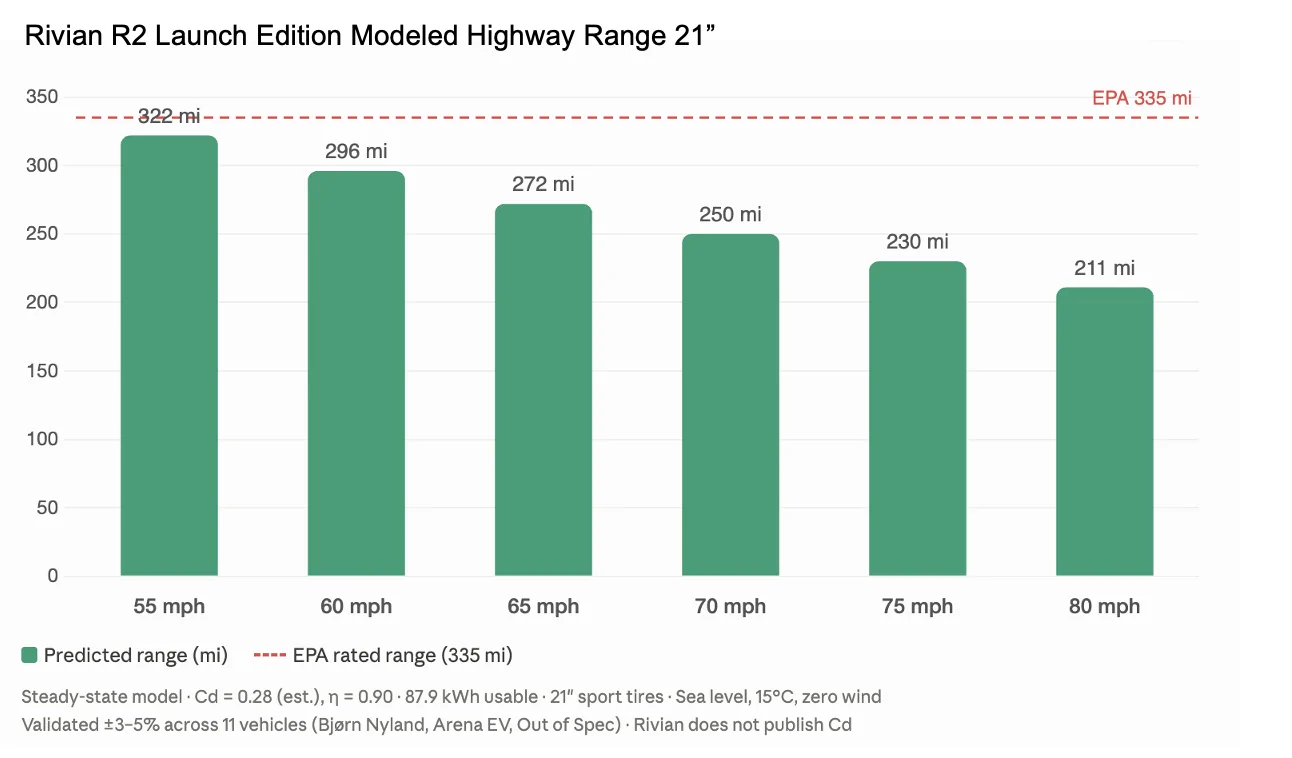
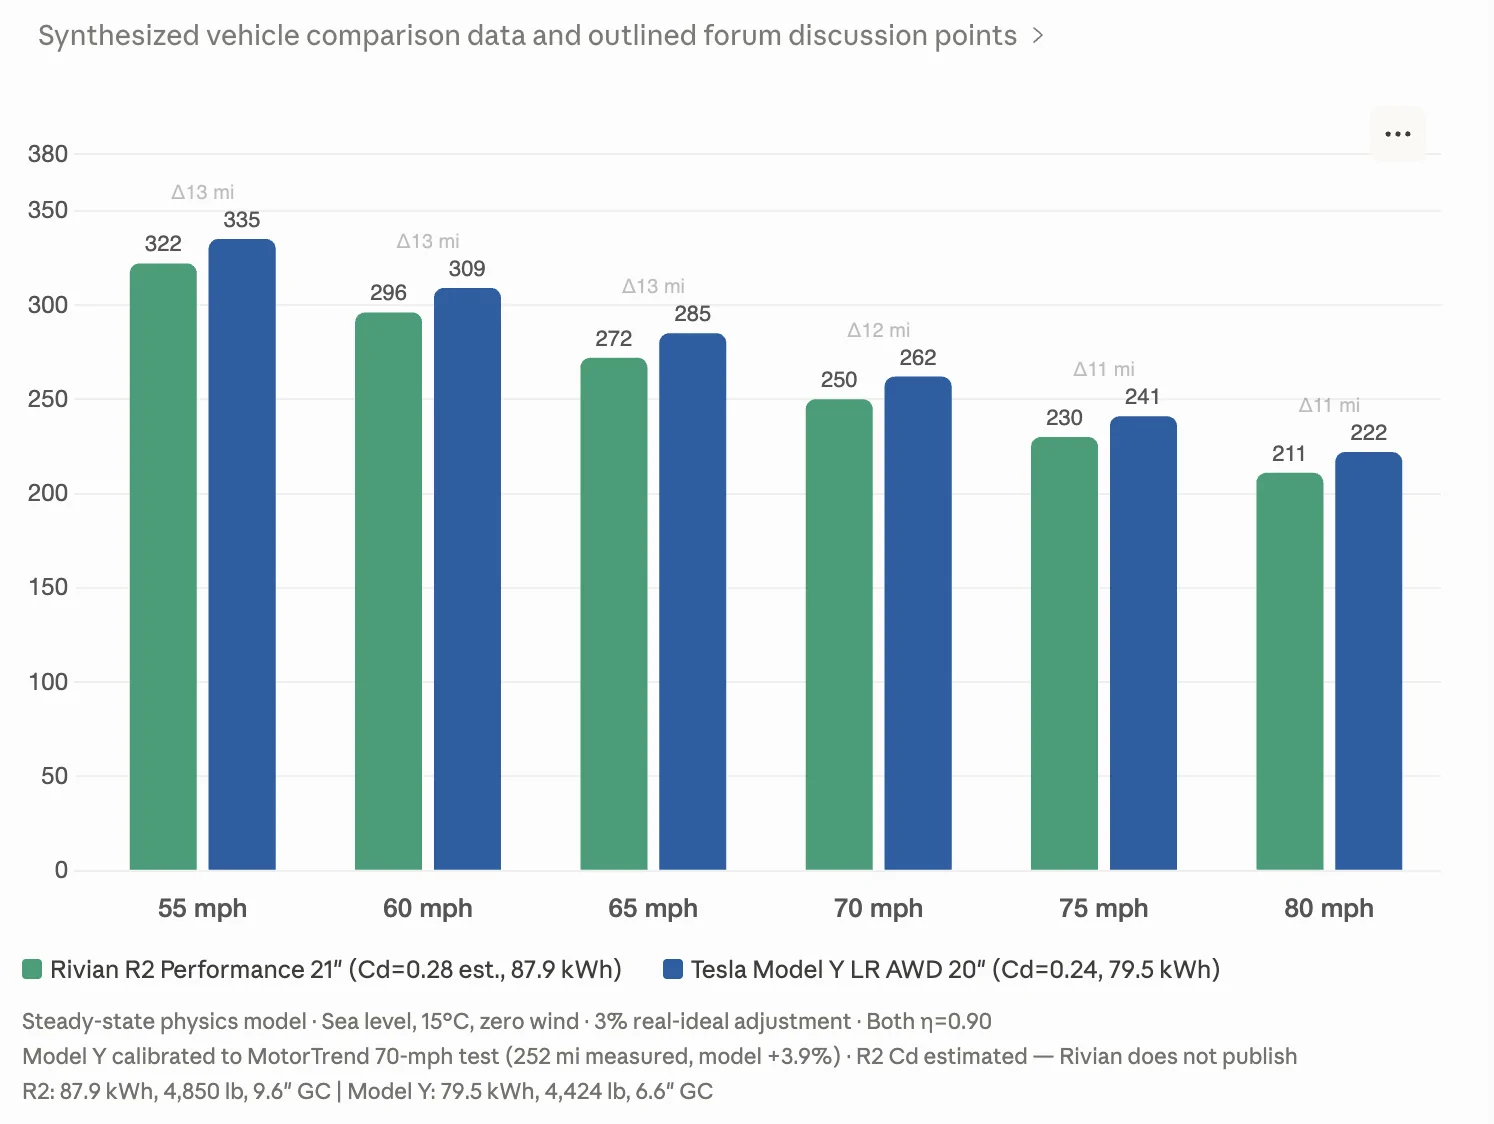
This is a longwinded post but the short version is I figured it was pretty straightforward to build a decent model to predict highway range. So I got together with Claude and Gemini and we did. I did this for another reason but then ran R2 through it and thought you folks would find it useful. The result is this: an AWD Launch Edition with 21" road tires should deliver ~250 miles of highway range at 70mph sea level in good weather (note Out of Spec at higher altitude add ~20 miles). This is pretty competitive with Model Y (Motortrend just benchmarked it at 252 which is consistent with the model).
I've summarized the model details below and attached the full writeup in pdf. It is sensitive to input data so that as always is the key caution.
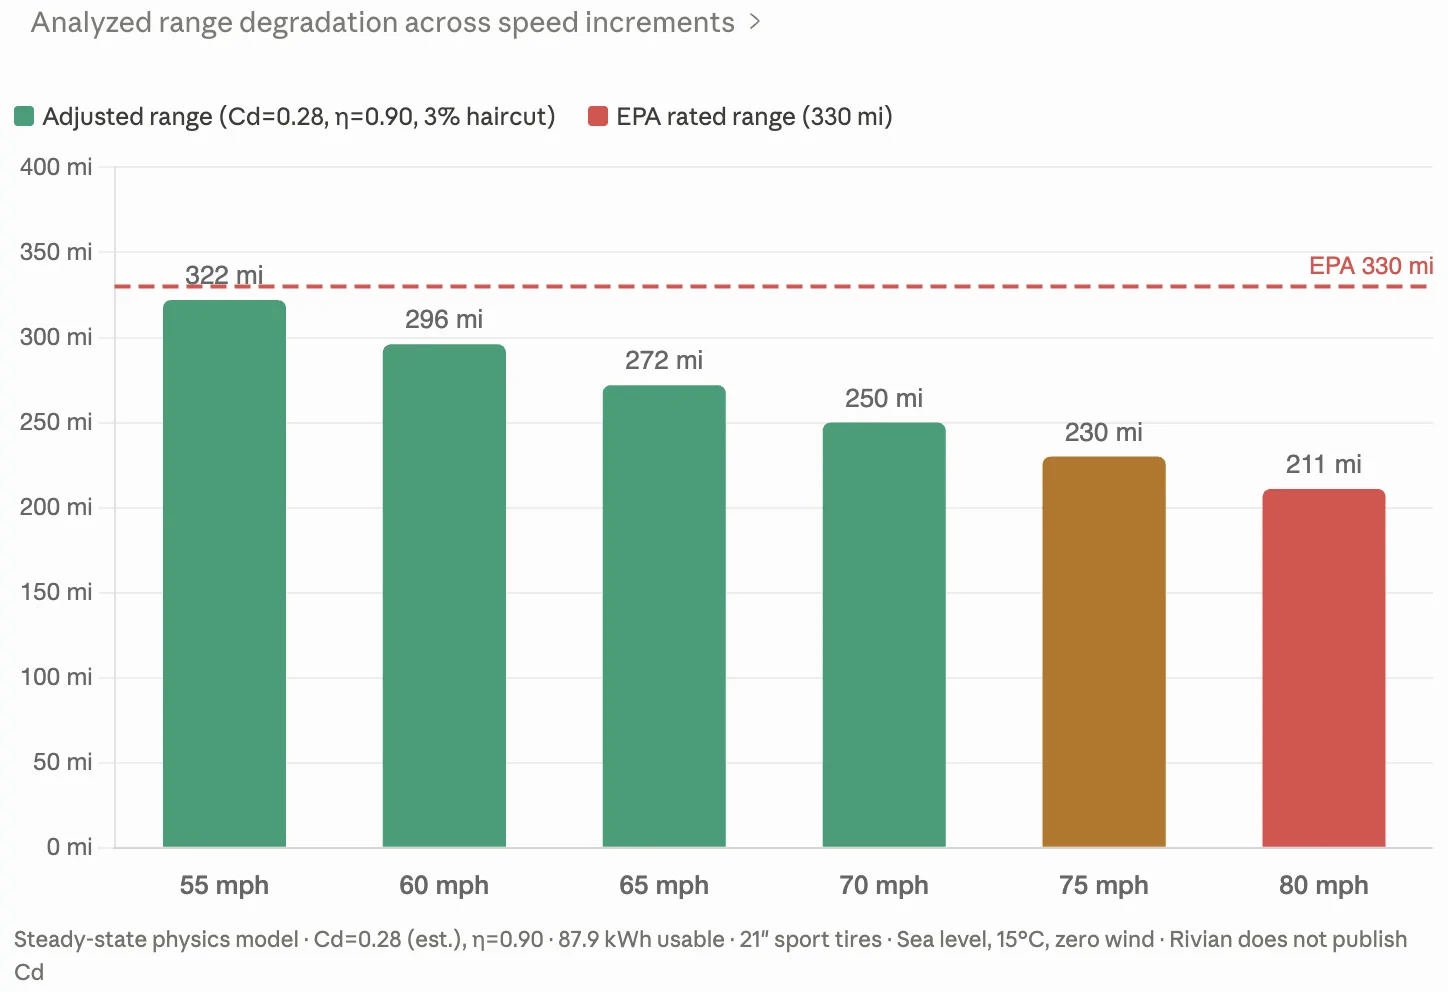
EDIT - Updated the EPA estimate to 335 from 330 (no impact on model)

Here is the modeled 2026 Model Y for comparison (AWD 20" wheels)

The Calculation
1 Mechanical Power Requirements
The mechanical power required at the wheels to sustain a constant velocity is the sum of aerodynamic drag power and rolling resistance power.
Aerodynamic drag power, which overcomes air resistance, scales with the cube of velocity:
P_aero = ½ × ρ × v³ × Cd × A
Rolling resistance power, which overcomes tire deformation and surface friction, scales linearly with velocity:
P_rr = m × g × Crr × v
Where ρ is air density (kg/m³), v is velocity (m/s), Cd is the drag coefficient, A is the dynamic frontal area (m²), m is total vehicle mass including payload (kg), g is gravitational acceleration (9.81 m/s²), and Crr is the rolling resistance coefficient.
2 Electrical Power Draw
The total draw from the battery pack adjusts the mechanical power requirement for drivetrain efficiency and adds the constant auxiliary power demand:
P_total = (P_aero + P_rr) / η + P_aux
Where η is the hardware-specific drivetrain efficiency and P_aux is the baseline auxiliary power draw for thermal management, computing, and HVAC systems.
3 Range Calculation
The consumption rate in Wh/mi is derived by dividing total power by velocity and converting units. The theoretical range is the usable battery capacity divided by this consumption rate, multiplied by the 0.97 real-ideal adjustment factor:
Consumption (Wh/mi) = (P_total / v) × 0.44704
Range (mi) = (E_bat × 1000 / Consumption) × 0.97
The 0.97 adjustment factor (3% haircut) was derived empirically from calibration against multiple benchmark vehicles and accounts for BMS management overhead, parasitic losses in power distribution, and minor regenerative braking losses during speed maintenance that are not captured in the steady-state power equation.
The Validation
The model was validated against two independent benchmark datasets: Arena EV (controlled-speed road tests at 56 and 81 mph in Europe) and Out of Spec Reviews (70 mph highway range tests in the United States). The steady-state physics model described in this paper provides a reliable, transparent, and validated method for predicting highway range of battery electric vehicles at constant speeds of 70–81 mph. The model achieves ±3–5% accuracy against independently measured benchmark data when environmental conditions (altitude, temperature) are accounted for.
The Critical Input Variables
The precision of the model depends entirely on the rigorous extraction of its physical constants. Generic baselines are avoided in favor of platform-specific hardware tagging and dynamic geometric extraction.
1 Aerodynamic Variables (Cd and A)
The drag area (CdA) is the primary determinant of high-speed range and requires the most critical refinement.
Drag Coefficient (Cd) is sourced from published manufacturer wind-tunnel data where available. Where manufacturers do not publish Cd (notably Rivian), values are estimated from independent CFD simulations and cross-referenced against range test results. The sensitivity of range predictions to Cd uncertainty is documented for each such vehicle.
Dynamic Frontal Area (A) is calculated from published vehicle dimensions rather than static bounding-box estimation. The formula subtracts the ground clearance void from the gross bounding box, then applies a vehicle-class fill factor:
A = [(Width × Height) − GC × (Width − 2 × TireWidth)] × FillFactor
The ground clearance void calculation excludes the area beneath the chassis where air passes freely, while retaining the tire footprint in the blocking profile. The fill factor accounts for greenhouse taper, fascia radius, and body sculpting that reduce the actual air-blocking area below the rectangular envelope.
A key finding of this research is that the fill factor for electric vehicles collapses to two categories rather than the three or four typically used for ICE vehicles. Because every EV designer optimizes the frontal profile for efficiency (CdA equals range), even vehicles that appear boxy from the side — including the Rivian R1S, Tesla Cybertruck, and Chevrolet Silverado EV — have heavily sculpted frontal profiles. The “boxy SUV” fill factor category that exists in ICE vehicle analysis does not exist in EV analysis.
2 Drivetrain Efficiency (η)
Drivetrain efficiency is tagged according to the specific electrical architecture of the vehicle, reflecting the combined efficiency of inverter, motor, and gearbox at steady-state highway operation. Generic industry averages are rejected in favor of architecture-specific multipliers.
Examples
800V SiC + Permanent Magnet
0.92 – 0.94
BMW Neue Klasse, Lucid, Porsche PPE, Hyundai E-GMP
Optimized 400V SiC
0.90 – 0.91
Tesla Model 3/Y/S/X, CT, Rivian R2
Standard 400V Silicon IGBT
0.88 – 0.89
Rivian R1, legacy GM/Ford platforms
3.3 Rolling Resistance (Crr)
Rolling resistance is tagged according to the physical tread pattern and compound of the specific tire fitted to the vehicle, not a generic vehicle-class assumption.
Examples
Optimized EV Road Tire (19–20")
0.0080 – 0.0085
Michelin LTX, Pirelli Scorpion Zero, Tempest
Performance / Sport Summer (21"+)
0.0090 – 0.0100
Eagle F1 Asymmetric, Pilot Sport EV
Aggressive All-Terrain
0.0120+
Pirelli AT Plus, BFGoodrich Trail-Terrain
3.4 Auxiliary Power (P_aux)
Auxiliary power represents the baseline thermal, computational, and HVAC load at steady-state highway conditions in the normalized 15°C environment. Two tiers are used: 1.2 kW for highly integrated heat pump systems (Tesla Octovalve architecture), and 1.5 kW for standard EV thermal management platforms.
3.5 Battery Capacity (E_bat)
The model uses BMS-accessible usable capacity, not gross pack size. Where discrepancies exist between manufacturer specifications and measured data (e.g., from OBD scans or drive-to-zero tests), the measured value is preferred. The Out of Spec Reviews dataset provides independently measured usable capacities for many vehicles and is used as the primary reference where available.

You should’ve just left out the line about Claude and Gemini and posted this and people would’ve thought you were aerospace engineer or PhD in spatial and fluid dynamics!This is a longwinded post but the short version is I figured it was pretty straightforward to build a decent model to predict highway range. So I got together with Claude and Gemini and we did. I did this for another reason but then ran R2 through it and thought you folks would find it useful. The result is this: an AWD Launch Edition with 21" road tires should deliver ~250 miles of highway range at 70mph sea level in good weather (note Out of Spec at higher altitude add ~20 miles). This is pretty competitive with Model Y (Motortrend just benchmarked it at 252 which is consistent with the model).
I've summarized the model details below and attached the full writeup in pdf. It is sensitive to input data so that as always is the key caution.
EDIT - Updated the EPA estimate to 335 from 330 (no impact on model)
Here is the modeled 2026 Model Y for comparison (AWD 20" wheels)
The Calculation
1 Mechanical Power Requirements
The mechanical power required at the wheels to sustain a constant velocity is the sum of aerodynamic drag power and rolling resistance power.
Aerodynamic drag power, which overcomes air resistance, scales with the cube of velocity:
P_aero = ½ × ρ × v³ × Cd × A
Rolling resistance power, which overcomes tire deformation and surface friction, scales linearly with velocity:
P_rr = m × g × Crr × v
Where ρ is air density (kg/m³), v is velocity (m/s), Cd is the drag coefficient, A is the dynamic frontal area (m²), m is total vehicle mass including payload (kg), g is gravitational acceleration (9.81 m/s²), and Crr is the rolling resistance coefficient.
2 Electrical Power Draw
The total draw from the battery pack adjusts the mechanical power requirement for drivetrain efficiency and adds the constant auxiliary power demand:
P_total = (P_aero + P_rr) / η + P_aux
Where η is the hardware-specific drivetrain efficiency and P_aux is the baseline auxiliary power draw for thermal management, computing, and HVAC systems.
3 Range Calculation
The consumption rate in Wh/mi is derived by dividing total power by velocity and converting units. The theoretical range is the usable battery capacity divided by this consumption rate, multiplied by the 0.97 real-ideal adjustment factor:
Consumption (Wh/mi) = (P_total / v) × 0.44704
Range (mi) = (E_bat × 1000 / Consumption) × 0.97
The 0.97 adjustment factor (3% haircut) was derived empirically from calibration against multiple benchmark vehicles and accounts for BMS management overhead, parasitic losses in power distribution, and minor regenerative braking losses during speed maintenance that are not captured in the steady-state power equation.
The Validation
The model was validated against two independent benchmark datasets: Arena EV (controlled-speed road tests at 56 and 81 mph in Europe) and Out of Spec Reviews (70 mph highway range tests in the United States). The steady-state physics model described in this paper provides a reliable, transparent, and validated method for predicting highway range of battery electric vehicles at constant speeds of 70–81 mph. The model achieves ±3–5% accuracy against independently measured benchmark data when environmental conditions (altitude, temperature) are accounted for.
The Critical Input Variables
The precision of the model depends entirely on the rigorous extraction of its physical constants. Generic baselines are avoided in favor of platform-specific hardware tagging and dynamic geometric extraction.
1 Aerodynamic Variables (Cd and A)
The drag area (CdA) is the primary determinant of high-speed range and requires the most critical refinement.
Drag Coefficient (Cd) is sourced from published manufacturer wind-tunnel data where available. Where manufacturers do not publish Cd (notably Rivian), values are estimated from independent CFD simulations and cross-referenced against range test results. The sensitivity of range predictions to Cd uncertainty is documented for each such vehicle.
Dynamic Frontal Area (A) is calculated from published vehicle dimensions rather than static bounding-box estimation. The formula subtracts the ground clearance void from the gross bounding box, then applies a vehicle-class fill factor:
A = [(Width × Height) − GC × (Width − 2 × TireWidth)] × FillFactor
The ground clearance void calculation excludes the area beneath the chassis where air passes freely, while retaining the tire footprint in the blocking profile. The fill factor accounts for greenhouse taper, fascia radius, and body sculpting that reduce the actual air-blocking area below the rectangular envelope.
A key finding of this research is that the fill factor for electric vehicles collapses to two categories rather than the three or four typically used for ICE vehicles. Because every EV designer optimizes the frontal profile for efficiency (CdA equals range), even vehicles that appear boxy from the side — including the Rivian R1S, Tesla Cybertruck, and Chevrolet Silverado EV — have heavily sculpted frontal profiles. The “boxy SUV” fill factor category that exists in ICE vehicle analysis does not exist in EV analysis.
2 Drivetrain Efficiency (η)
Drivetrain efficiency is tagged according to the specific electrical architecture of the vehicle, reflecting the combined efficiency of inverter, motor, and gearbox at steady-state highway operation. Generic industry averages are rejected in favor of architecture-specific multipliers.
Examples
800V SiC + Permanent Magnet
0.92 – 0.94
BMW Neue Klasse, Lucid, Porsche PPE, Hyundai E-GMP
Optimized 400V SiC
0.90 – 0.91
Tesla Model 3/Y/S/X, CT, Rivian R2
Standard 400V Silicon IGBT
0.88 – 0.89
Rivian R1, legacy GM/Ford platforms
3.3 Rolling Resistance (Crr)
Rolling resistance is tagged according to the physical tread pattern and compound of the specific tire fitted to the vehicle, not a generic vehicle-class assumption.
Examples
Optimized EV Road Tire (19–20")
0.0080 – 0.0085
Michelin LTX, Pirelli Scorpion Zero, Tempest
Performance / Sport Summer (21"+)
0.0090 – 0.0100
Eagle F1 Asymmetric, Pilot Sport EV
Aggressive All-Terrain
0.0120+
Pirelli AT Plus, BFGoodrich Trail-Terrain
3.4 Auxiliary Power (P_aux)
Auxiliary power represents the baseline thermal, computational, and HVAC load at steady-state highway conditions in the normalized 15°C environment. Two tiers are used: 1.2 kW for highly integrated heat pump systems (Tesla Octovalve architecture), and 1.5 kW for standard EV thermal management platforms.
3.5 Battery Capacity (E_bat)
The model uses BMS-accessible usable capacity, not gross pack size. Where discrepancies exist between manufacturer specifications and measured data (e.g., from OBD scans or drive-to-zero tests), the measured value is preferred. The Out of Spec Reviews dataset provides independently measured usable capacities for many vehicles and is used as the primary reference where available.
")
Question though. Isn’t there an additional element in the R2 from an engineering standpoint where it either switches off one of the motors or adjusts efficiency at the motor or dare I say mechanical cluth to optimize efficiency even further at highway speeds? I remember seeing something in the initial launch video throughout the engineering piece, but I can’t recall exactly what the mechanical or electrical engineering bit was.
And I’m not sure if that type of implementation is the same in the Tesla model Y. Certainly there’s no second speed or transmission in the model Y. But lots of OEMs are moving to a highway speed, mechanical or electrical shift to optimize that highway speeds for as much efficiency as possible, where force against the frontal area is the demon.
Sponsored
Last edited:
