
Sponsored
OP
OP
ksurfier

ksurfier

Well-Known Member
First Name
Ken
Joined
Aug 23, 2022
Threads
51
Messages
1,167
Reaction score
1,110
Location
CA
Vehicles
R1S, Tesla
Occupation
Fake Science Lead
Clubs
 
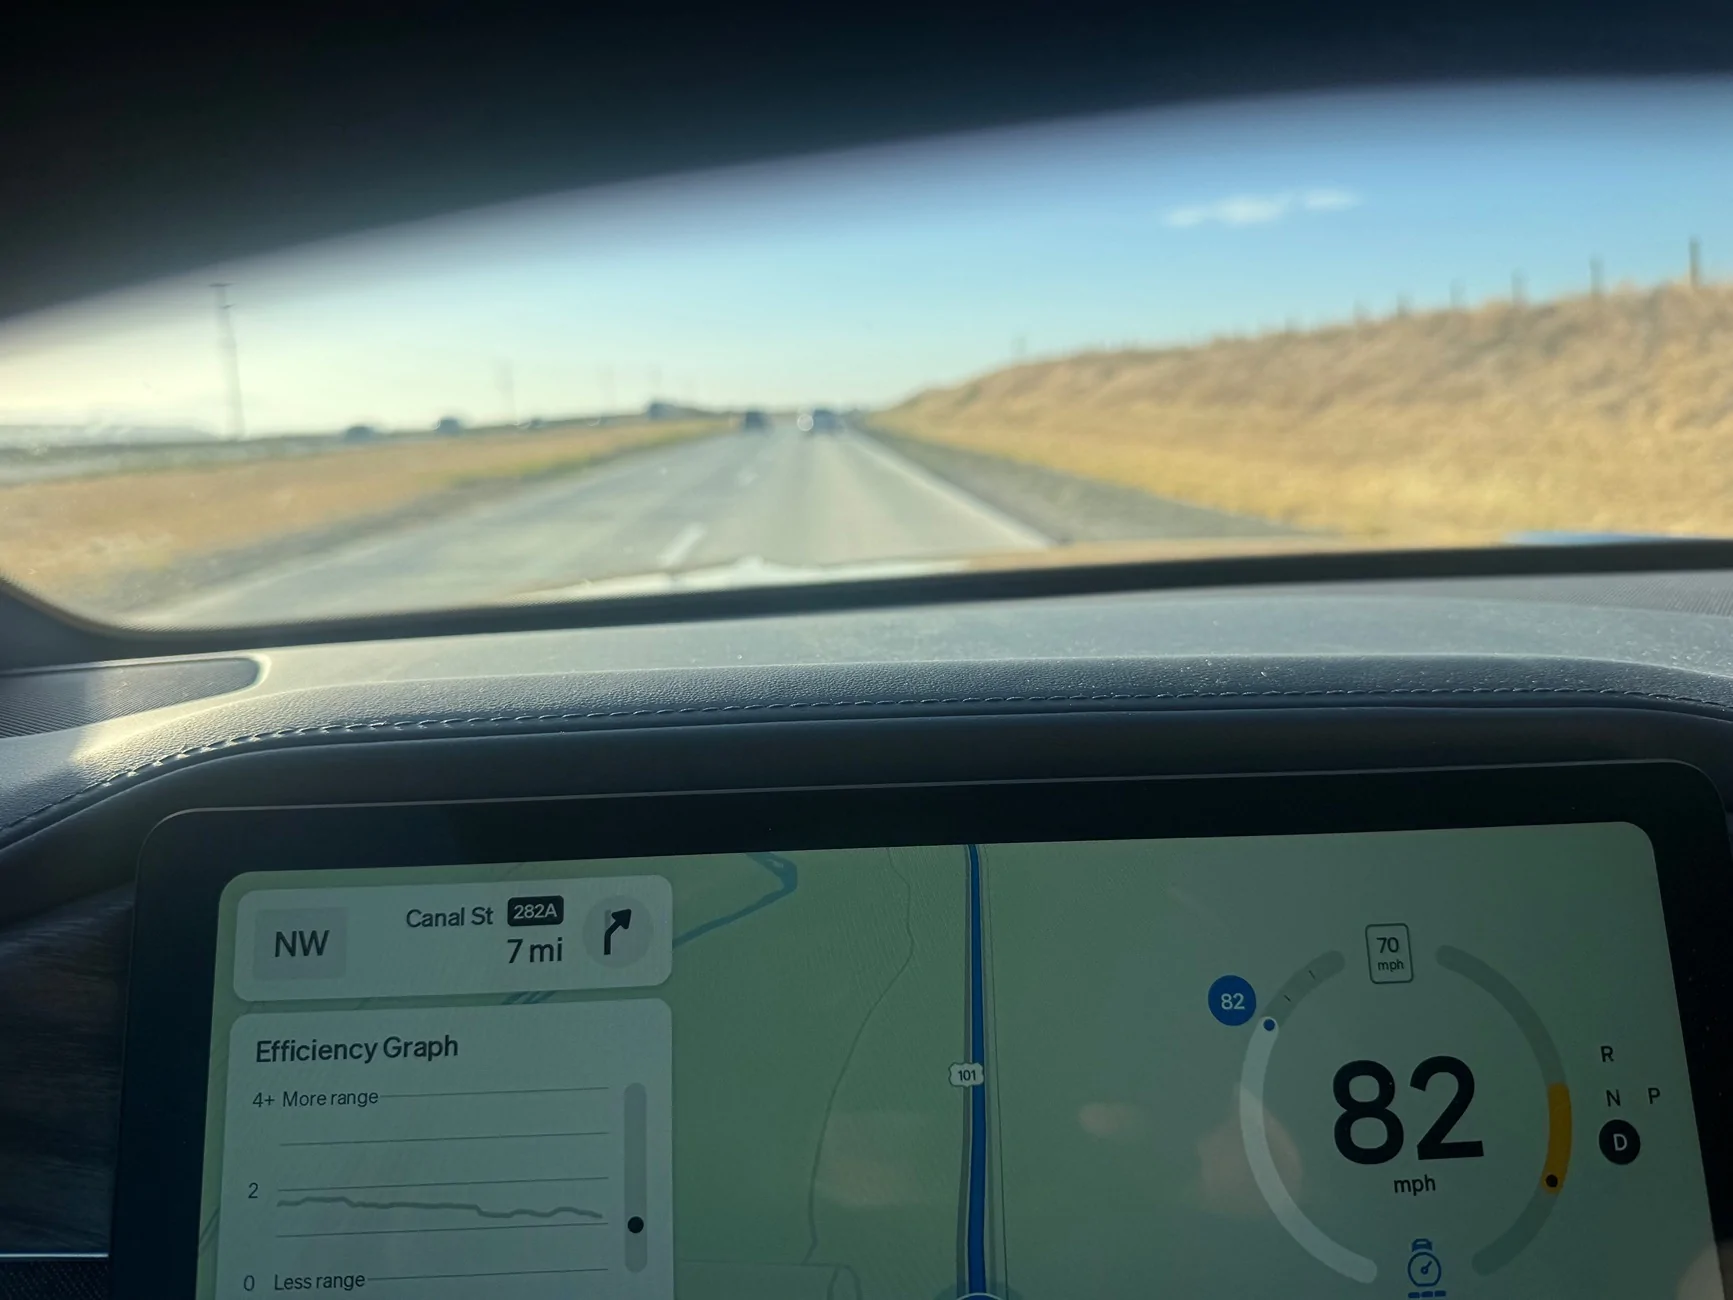
Ironically, I spent a great deal of time today along the central coast at 80 mph and even into a headwind (got 1.3 MPK - that was a first!). So I wouldn’t say it’s all that unusual…I’d say going less than 75 is extremely rare.

Edit: I pulled up to a sheriff going 80 (me) and was side by side, my wife suggested I slow down and I think it was a fair request…he dropped to 65 and created a 20-30 car pile up all going 65, then after 5-10 minutes pulled someone over for what was likely a cell phone…

Rivian R1T R1S R2 Highway Efficiency Test: 80 MPH vs 70 MPH Changed Everything IMG_7674
Sponsored

 
Last edited:

Indy avocado

Well-Known Member
First Name
Greg
Joined
Dec 17, 2022
Threads
3
Messages
224
Reaction score
313
Location
Indiana
Vehicles
'22 R1T, '17 Macan S, '11 Mustang GT
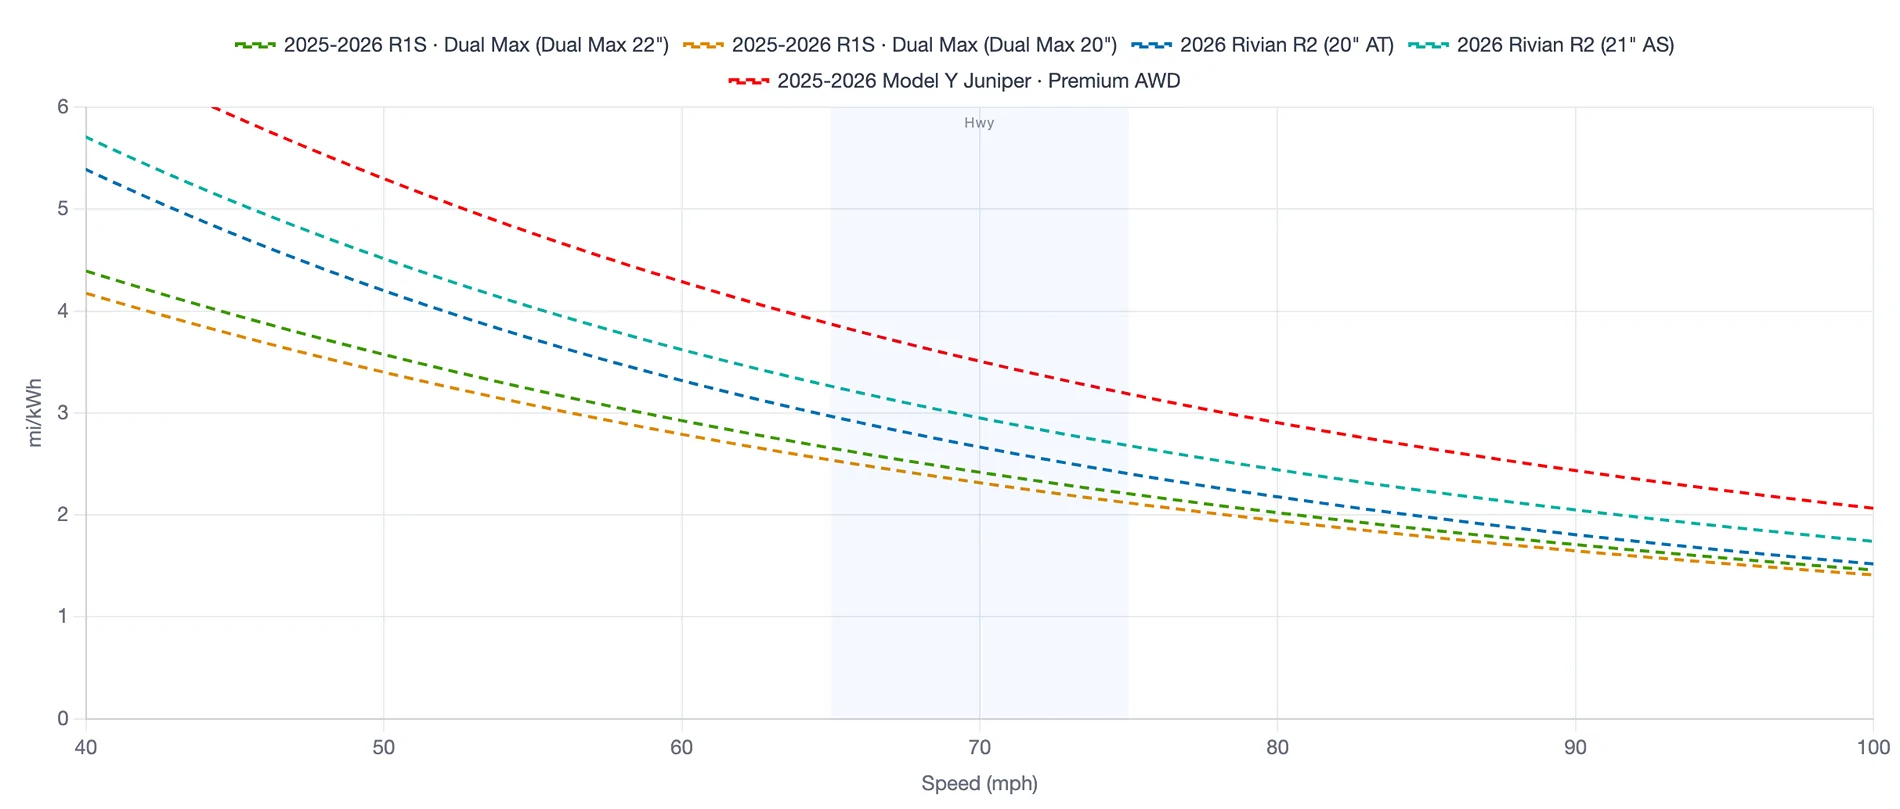
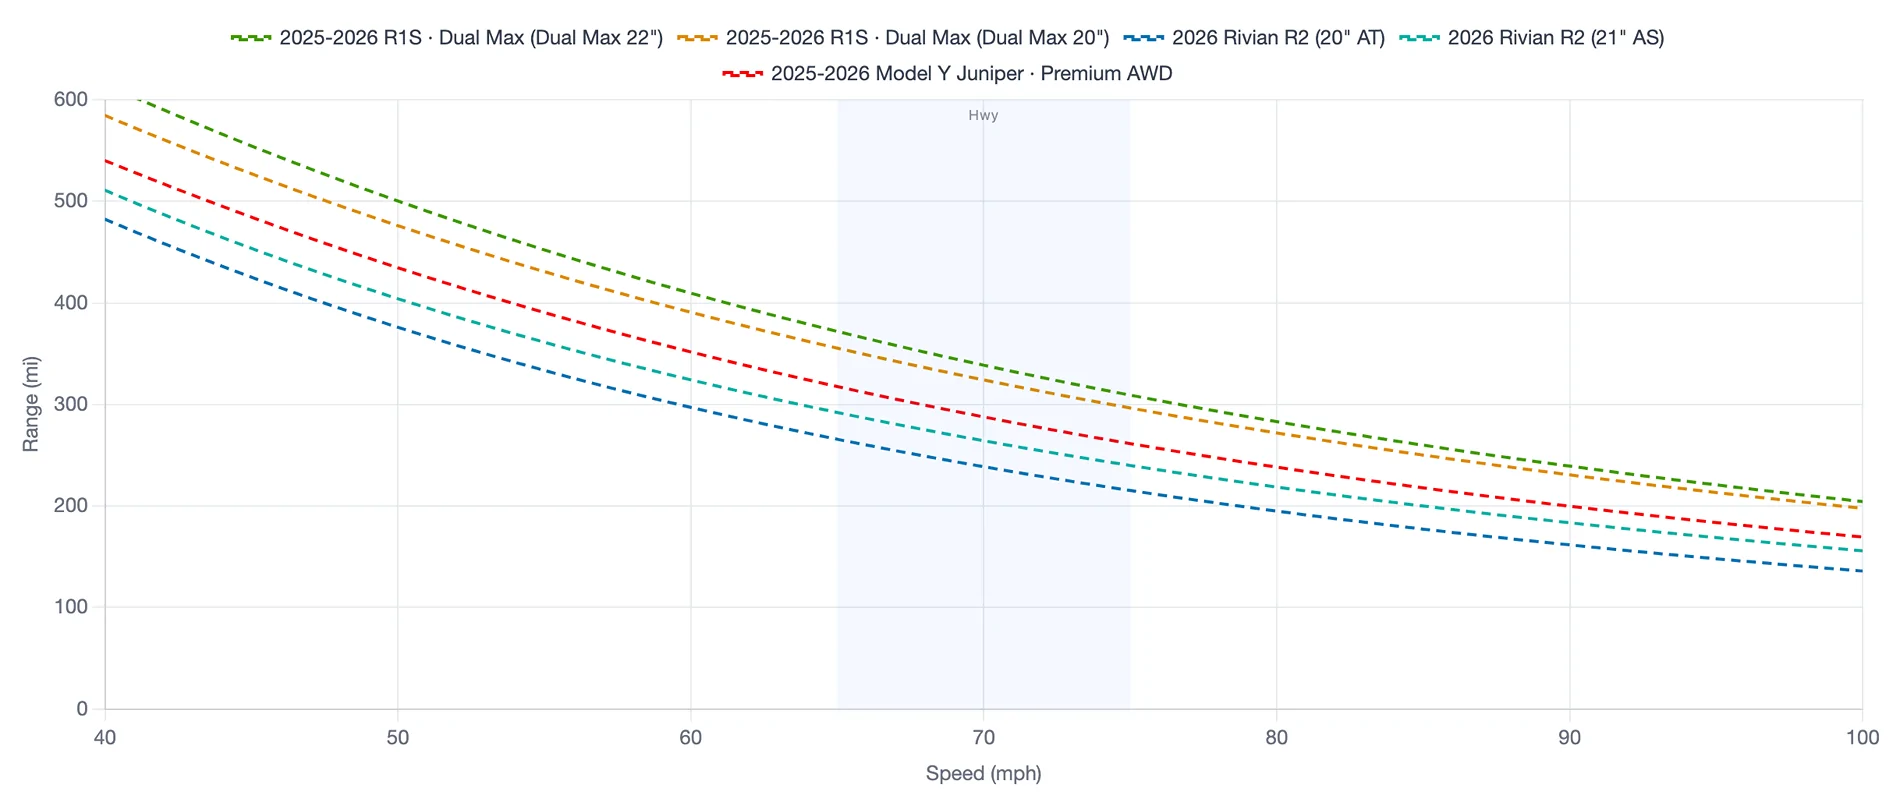
EPA has dynomometer values that tend to very accurately predict "nice day highway" efficiency and range.

Below plots assume *very* light HVAC load.

Some summary

Efficiency:
Rivian R1T R1S R2 Highway Efficiency Test: 80 MPH vs 70 MPH Changed Everything 1784357008617-hz


Range:
Rivian R1T R1S R2 Highway Efficiency Test: 80 MPH vs 70 MPH Changed Everything 1784356870538-hc


My range model was forecasting this at 229 (+/-) at 80. If your data holds over longer distances, the model may be very optimistic.
I think your Model Y numbers are slightly pessimistic, possibly optimistic on R2, but very close to a perfect day range test. I am thinking 265mi (vs your 271) at sea level for the 21" Performance. The Model Y should be 285-295mi.


1. Direct testing: InsideEVs measured about 2.97 mi/kWh under favorable Colorado conditions.
2. Physics: The R2’s estimated CdA predicts approximately 2.5–2.7 mi/kWh at sea level.
3. Vehicle comparison: The R2 falls exactly between the Model Y and R1, where its estimated CdA places it.
4. Battery capacity: Multiplying 2.5–2.9 mi/kWh × 88 kWh gives approximately 220–255 miles usable, depending on conditions, with favorable conditions approaching 260 miles.
This all checks out.

My calculator finds 2.94mi/kWh @ 70mph and 5000ft elevation (20" AT). Sounds like it's spot-on with InsideEVs.
Adjusting back to sea level (above screenshots) and we get 2.67mi/kWh, just as #2


No, just kicked them...everyone was looking at me funny...:bandit:

But ABRP shows the following (only a ~5% difference betweem 20" and 21")
R2 at 80 mph can travel ~190 miles (2.16 MPK)
R2 at 75 mph can travel ~200 miles (2.3 MPK)
R2 at 70 mph can travel ~213 miles (2.45 MPK)
R2 at 66 mph can travel ~225 miles (2.6 MPK)
R2 at 58 mph can travel ~250 miles (2.85 MPK)
These all seem to be pessimistic, as they should be for a route planning tool, but perhaps unnecessarily so?


Did some crude gpt calculations on incorporating charge times and distance traveled to see if charging more at 80 mph is worth it at any distance.
As a thought exercise I was curious to calculate the time efficiency of the R2 over long distance.
...
Bottom line, driving fast and charging more is faster on a long road trip than slower with less frequent charging sessions.
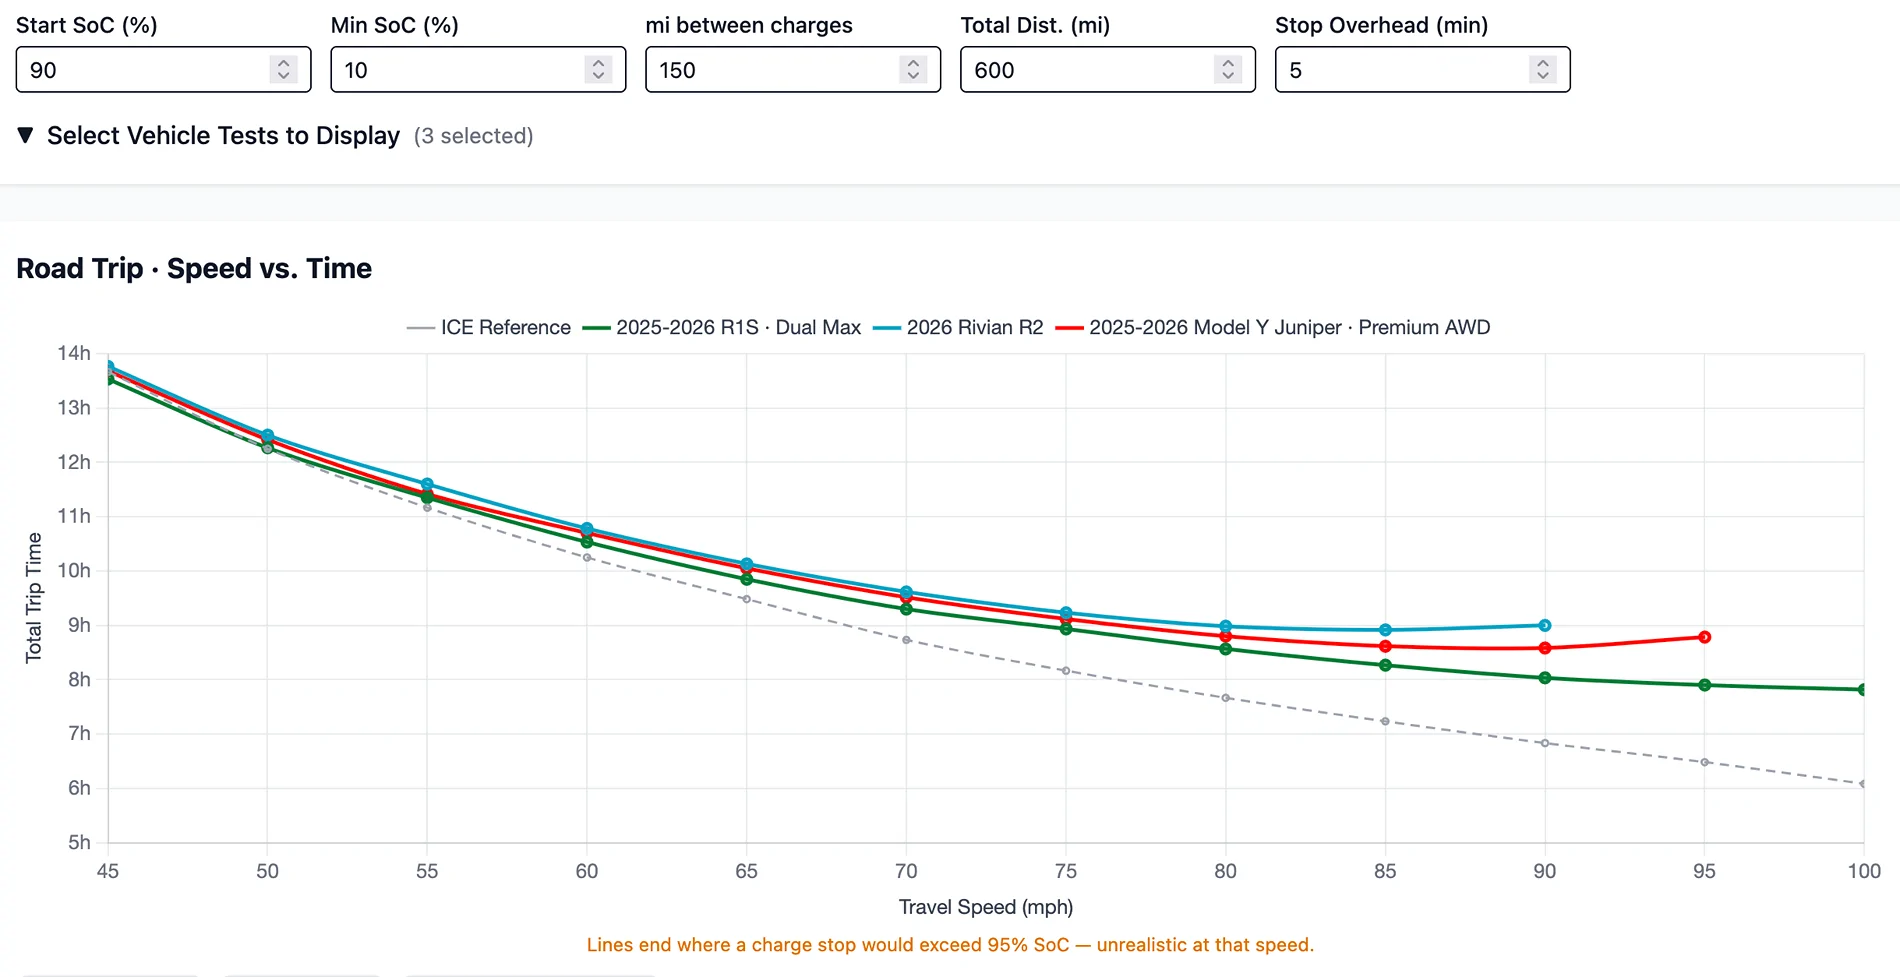
Lets compare with my calculator (uses discrete stops, estimates time from measured charging curves & 70mph range tests):
70 vs 80mph over 600mi, R2 saves ~38 minutes at 80mph.

Optimal travel speed is right around 85mph, but certainly diminishing returns over 75.

Rivian R1T R1S R2 Highway Efficiency Test: 80 MPH vs 70 MPH Changed Everything 1784357681348-w3


Top