Sponsored

Off Road Range for EV? Jeep 4xe Review / Comparison from TFL

ajdelange

Well-Known Member
First Name
A. J.
Joined
Aug 1, 2019
Threads
9
Messages
2,883
Reaction score
2,317
Location
Virginia/Quebec
Vehicles
Tesla XLR+2019, Lexus, Landcruiser, R1T
Occupation
EE Retired
They should have plenty of data based on how much off road mileage they appear to have done to have a reasonably idea as to a ballpark loss in range when you hit a gravel road or go off-roading.
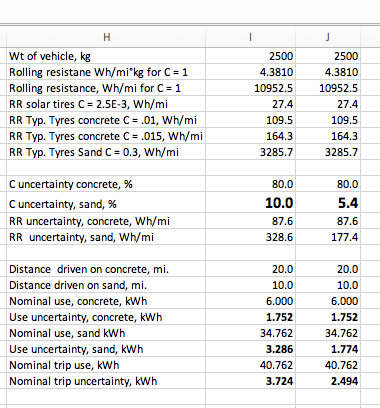
I gather you are relatively new to BEV. I think your opinion on this will change as you garner experience.

The reality is that you can't predict Wh/mi with much accuracy on a particular piece of road until you drive it. If your geo database shows it is uphill you can add gravitational load to the nominal and if you know you have a 20 mph headwind you can add drag load. But you can't know whether the road bed is wet or dry even if the observed weather at the nearest airport shows it is raining. Nor can you predict what the wind vector will be when you get to a particular location based on the last hour's METAR from an airport 20 miles away. Nor can you tell whether a dirt road was graded and oiled (do they still oil dirt roads?) this morning.

Given all this you must take predictions from ABRP and similar programs with a grain of salt (literally though the salt may be CaCl2 rather than NaCl). Whilst on your journey your best indicator as to how much battery you will have at destination is the amount you have at a particular point you you are currently using per mile.

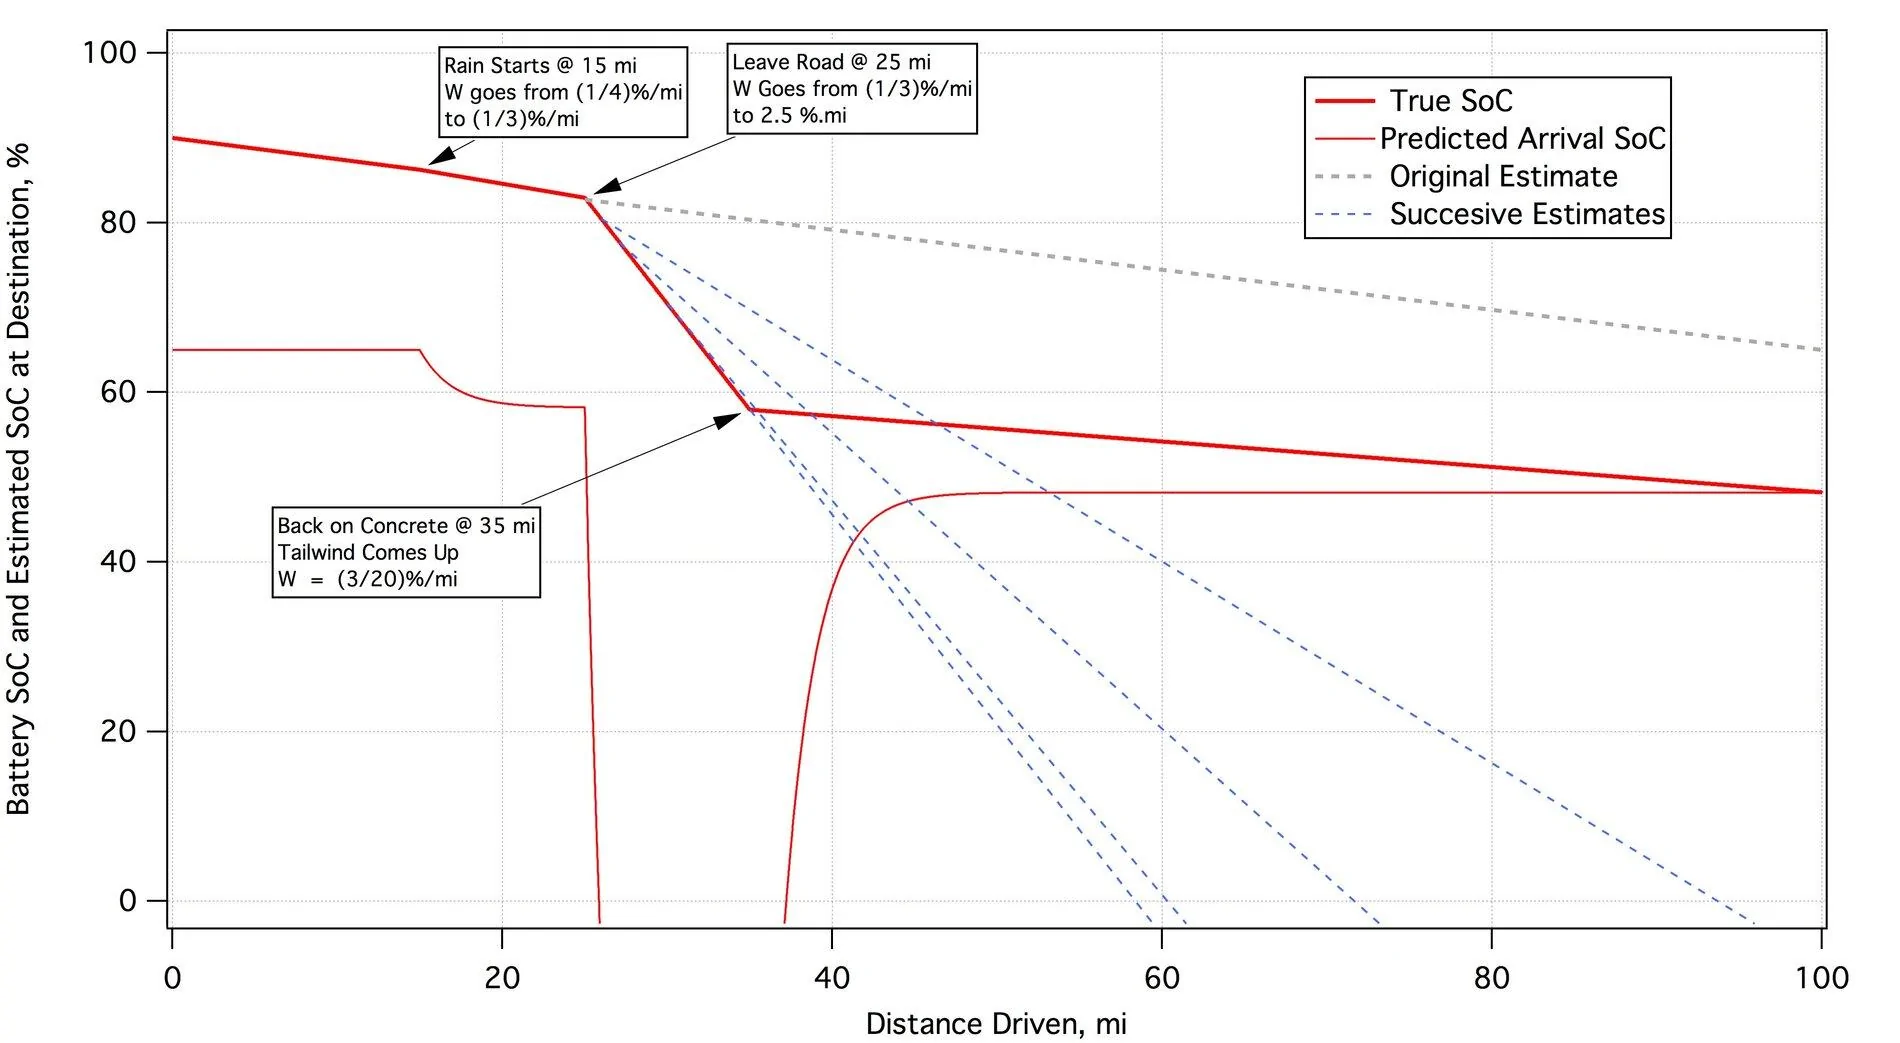
The following illustrates how this works in Tesla's implementation.

Rivian R1T R1S Off Road Range for EV? Jeep 4xe Review / Comparison from TFL IMG_1580


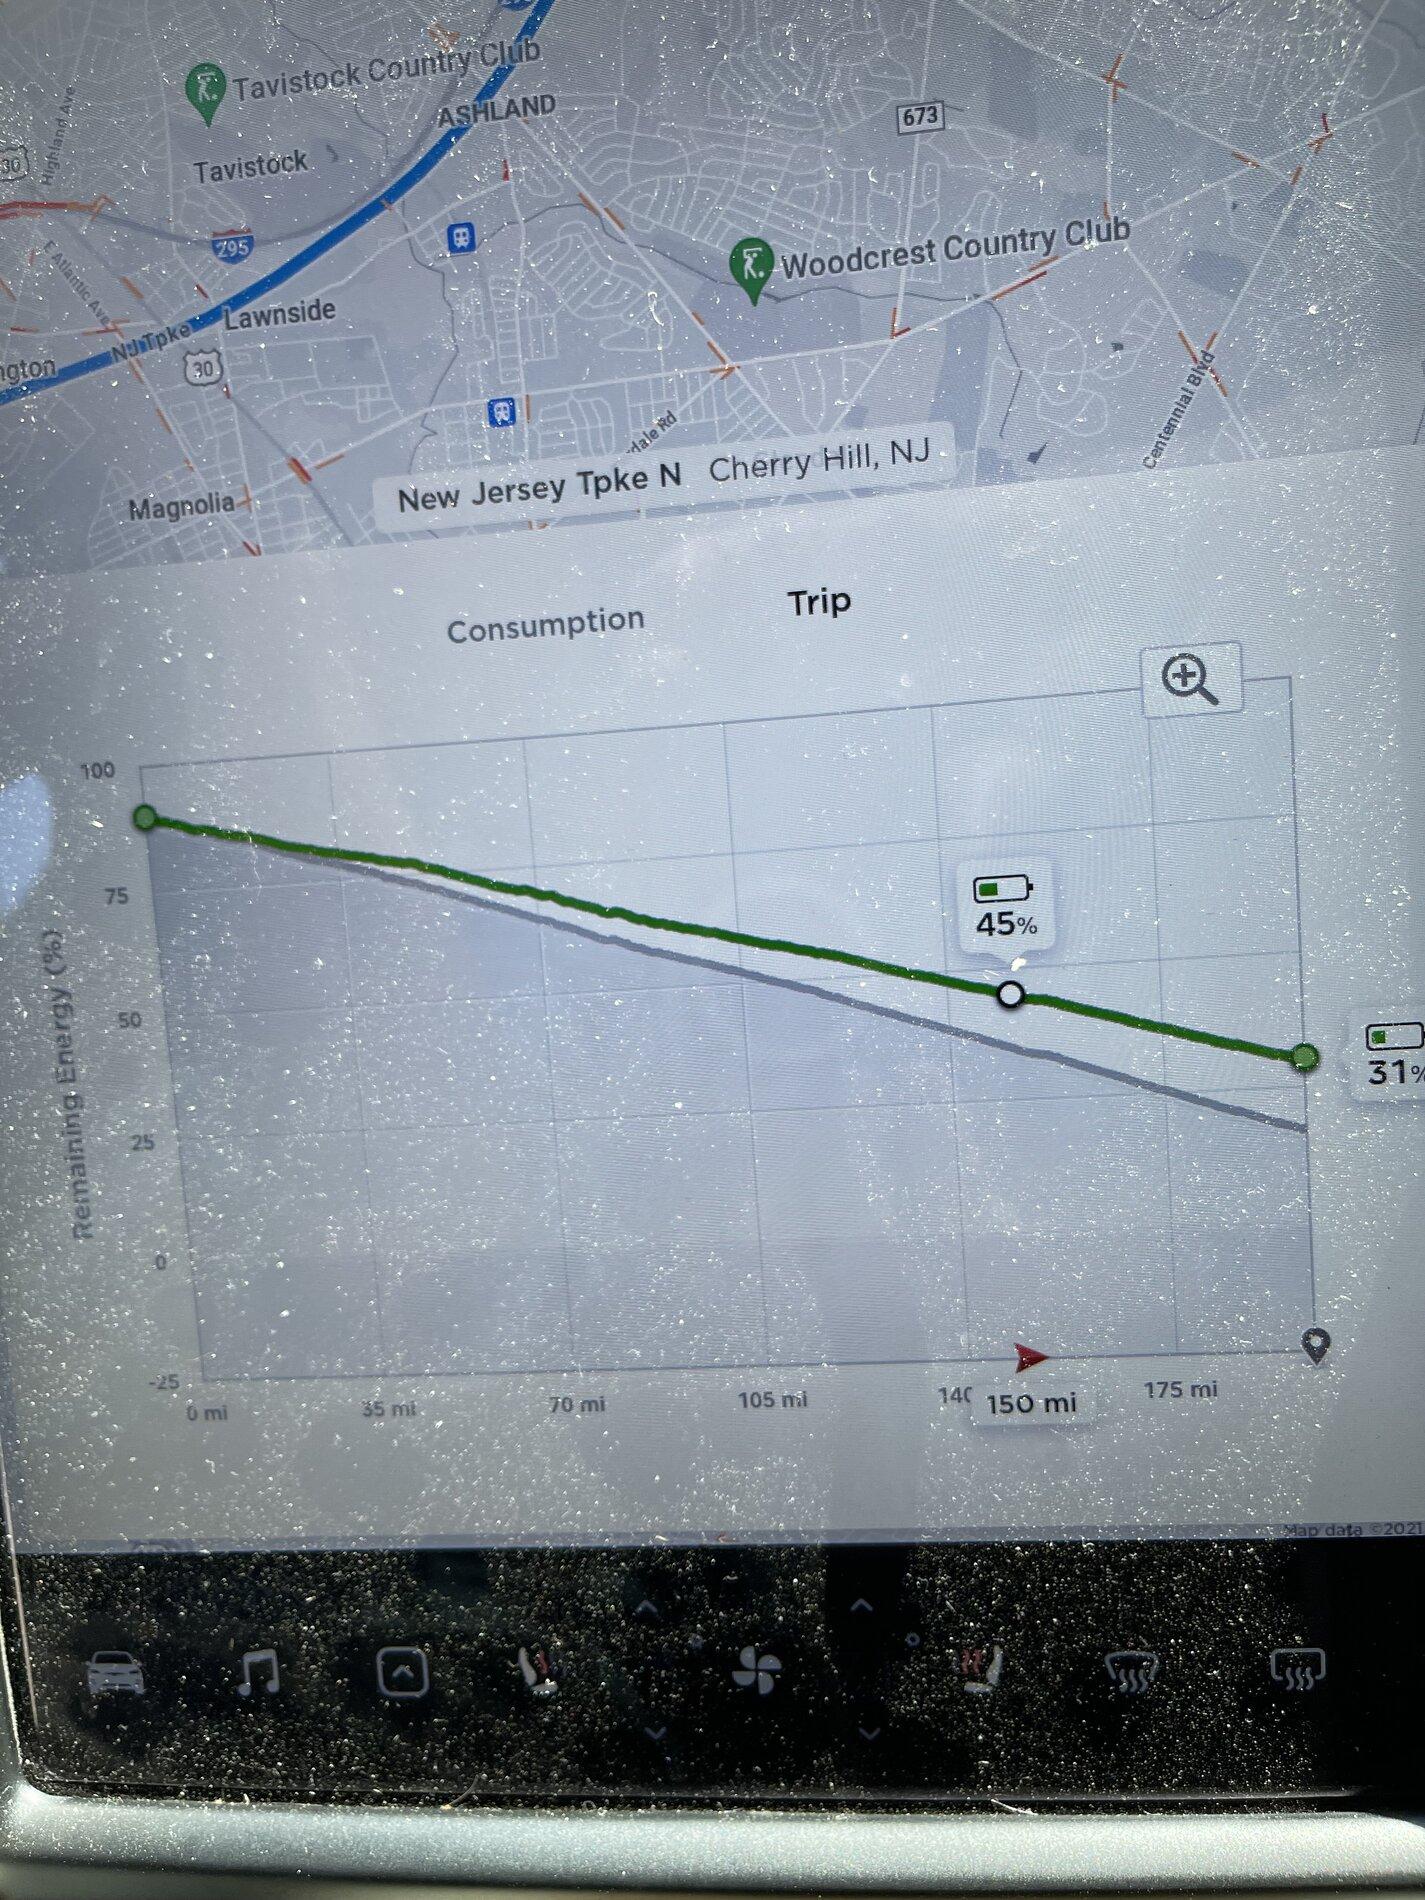
The lower line shows the vehicle's original expectations as to how the trip will go: Start with 90% SoC, arrive with 20%. The upper heavy line shows, up to the circle, the actual history. At 150 mi out we are at 45% SoC rather than the ariginally forecast 35%. In this case we are doing quite a bit better than we thought we would probably because of a tailwind. The algorithm projects to the destination assuming the recent utilization rate and what it knows about terrain, speed limit and weather (not really sure about weather) ahead of you. It cannot predict a storm coming up or the fact that roadwork has started and you have to drive in loose gravel or that the wind will veer from tailwind to headwind. If any of those events occurs then utilization zooms and the red curve dips as does it's end point.
Sponsored

 
Last edited:

SeaGeo

Well-Known Member
First Name
Brice
Joined
Jan 12, 2021
Threads
47
Messages
5,237
Reaction score
9,677
Location
Seattle
Vehicles
Xc60 T8
Occupation
Engineer
The algorithm projects to the destination assuming the recent utilization rate and what it knows about terrain, speed limit and weather (not really sure about weather) ahead of you.
The reality is that you can't predict Wh/mi with much accuracy on a particular piece of road until you drive it.
Your argument is not internally consistent. And it's clear you don't have any formal education in transportation systems that don't involve flying. That being said, moving beyond the "expertise" pissing match that you like to start posts where you think your being helpful with:

Yes, you can predict wh/mi before driving on a road. Your Tesla literally does it every time you drive as you showed. as does ABRP. And ABRP actually does a really damn good job with inclusion of my calibrated ID.4 data tbh.

Your Tesla assumes you are on pavement with it's baseline efficiency assumption. I doubt they make any effort to address driving surface type (maybe they do, they aren't terribly transparent). Not because they can't, but because it's an outlier case for their vehicles.

Different vehicle systems (and abrp) then take different approaches to modeling anticipated usage. Some literally don't use any available context to refine their estimate and base it off recent driving data. Which is just lazy and pisses me off because it's so bad. Some refine that by incorporating topography, wind, driving speed etc. Obviously. Just like your Tesla does when you map a destination. Or abrp. Or Audi's internal maps. The Ford lightning will even try to intentionally incorporate payload and towing information. The lightning actually has scales on the truck to help inform the predicted range.

Driving surface is literally just another variable to take into account. And it's actually not one that's particularly unknown, and has been studied for transportation systems, infr6 management, and to help inform policy decisions regarding field consumption. In fact, it was actually touched upon in school for me in one of my literal transportation classes.

Manufacturers could use their own baseline data for their vehicle on different driving surfaces (and continue to supplement it with real world data in the same way ABRP does), or they could literally just incorporate a metric like road IRI and the anticipated impact that will have on efficiency. In fact, if they wanted, they could also take a stab at pavement age and type (PC vs HMA for example) into an IRI value, but I don't actually think there is a publicly available single source dataset for pavement type and age.

Driving surface type is literally just another variable that can be input to help refine the range estimate. It's known an unknowable unknown. Will the individual variable have a relatively large degree of uncertainty? Sure. However, literally every variable for prediction has uncertainty. But incorporating it would reduce the overall uncertainty of the prediction.
 

Temerarius

Well-Known Member
First Name
Chase
Joined
May 26, 2021
Threads
1
Messages
381
Reaction score
1,196
Location
Kirkland, WA
Vehicles
2017 Tesla Model X, 2018 Ram 1500 EcoDiesel
Occupation
Sr. Program Manager
Driving surface is literally just another variable to take into account. And it's actually not one that's particularly unknown, and has been studied for transportation systems, infr6 management, and to help inform policy decisions regarding field consumption. In fact, it was actually touched upon in school for me in one of my literal transportation classes.
And even adding on top driving surface, surface condition (rain for example), wind, etc... you also have the rolling resistance of your tires (which of course will change based on load, temp, speed, and the speed they are running on a given surface etc...

Most GoM's are "meh" at best, due to the sheer number of variables involved.
 
Last edited:

Trekkie

Well-Known Member
First Name
Tom
Joined
Jun 3, 2021
Threads
15
Messages
360
Reaction score
584
Location
Wake Forest, NC
Vehicles
2021 ID.4, 2022 Polestar 2, 2023.5 Defender 110
Occupation
IT Nerd
this is another review of that 4xe. The battery looks to be not much more than something that made it heavier. Kinda disappointed. I'm not in the market for one, but my 11 yo daughter is big into wanting a Jeep and I've told her has to be full battery :)
 

ajdelange

Well-Known Member
First Name
A. J.
Joined
Aug 1, 2019
Threads
9
Messages
2,883
Reaction score
2,317
Location
Virginia/Quebec
Vehicles
Tesla XLR+2019, Lexus, Landcruiser, R1T
Occupation
EE Retired
Your argument is not internally consistent.
OK. Show me where I'm inconsistent and we'll discuss it.

And it's clear you don't have any formal education in transportation systems that don't involve flying.
What in heavens name does this have to do with it? I don't have any formal education in transportation systems that involve flying either. This isn't rocket science. It's more simple estimation theory than anything else.

That being said, moving beyond the "expertise" pissing match that you like to start posts where you think your being helpful with:

Yes, you can predict wh/mi before driving on a road. Your Tesla literally does it every time you drive as you showed. as does ABRP.
I's this a semantics question? I call what it does "estimating" the SoC at every point along the proposed route. It can and does model certain things, such as speed and the effects of going up or down a hill (that's what cause the little wobbles in the gray line). But there is no way it can know a-priori what the wind will be, whether the road will be wet or not or whether I will drive over or under the speed limit. If you want to call those estimates "predictions" OK, we'll say my Tesla has predicted the consumption at every point along the route. The central point of what I am trying to convey and what the picture from the Tesla shows that the predictions are pretty lousy because actual conditions were different from what was assumed when the Tesla made the prediction.

I'm going to jump to what I thing is at the heart of the discussion.


Driving surface type is literally just another variable that can be input to help refine the range estimate. It's known an unknowable unknown. Will the individual variable have a relatively large degree of uncertainty? Sure. However, literally every variable for prediction has uncertainty. But incorporating it would reduce the overall uncertainty of the prediction.
What we want to predict is SoC at destination. This is relevant before setting out and at every point along the route as we are driving it. This estimate is S = S0 - ∑d_i*w_i in which the sum is over N distance increments the ith of which is d_i (∑d_i = the distance from where we are to the destination), w_i is what we think the consumption per mile will be in the ith distane increment and S0 is our current measurement of SoC. But we do not know the true consumption Thus each w_i is the true value of utilization, mu_i, plus an error (uncertainty), u_i. As is usual we assume that the uncertainties are Gaussian random variables distributed about 0 with standard deviations sigma_i. The estimate is then S = S0 - ∑d_i*mu_i - ∑d_i*u_i. This has mean mean = S0 -d_i*mu_i and variance (mean - ∑d_i*mu_i)^2
which, assuming uncertainties are not correlated, is ∑(d_i*sigma_i )^2 and the uncertainty in the estimate is then the square root of this sum. And this is what the whole discussion turns on. The errors RSS. The uncertainty in the estimate depends on the uncertainties in the individual consumption estimates and over how many miles each estimate applies. To give a little perspective on this I looked up some rolling resistance coefficients and assumed that one did a 30 mile drive 20 miles on cement and 10 miles on sand. The numbers are summarized in the spreadsheet below
Rivian R1T R1S Off Road Range for EV? Jeep 4xe Review / Comparison from TFL uncert


I used 2500 kg for the weight of the vehicle because that's what my MX weighs. I used 80% uncertainty in C, the coefficient, for a surfaced road because I have seen increases in consumption wet vs dry to suggest that it can vary that much. I used 10% variation in C for sand because I feel that sands's coefficient has to vary by at lest that much depending on how tightly it is packed, whether it is wet or not etc. The essential thing to get here is that sand's C is 30 times that of cements and that, therefore, even a small uncertainty is C can introduce a large uncertainty in consumption and that the nature of the RSS causes that uncertainty to dominate the smooth surface C uncertainty even though the uncertainty in C for the cement is 8 times that for C in sand and we are driving twice as far on cement. The second column has everything the same except that I have cut the uncertainty in Csand about in half in order to get the sand and cement uncertainties equal.

Thus the example shows that if it rains and doubles C for a surfaced road the consequence is an error of about 1.7 kWh or 1.7% of my battery for a 20 mile trip or 17% of it for a 200 mile trip. Thus on surfaced road I can live with 80% uncertainty. In an off road condition where C can evidently get at least as high as 0.3 would be a disaster. We'd need uncertainties better by a factor of about 15. I don't believe that to be possible. Do I believe CV (coefficient of variation) for a practically accessible off road C data base is possible. No, I don't and that is why I am saying that I don't think Rivian will be offering such a thing.

So suppose you are planning a day running around a set of sand dunes. What kind of range should you expect to obtain. You'd better not use the EPA range of the vehicle based on C = .01. You'd better use C = 0.3, 30 times worse and expect mileage to drop by a factor of 1 + (30 - 1)f where f = the ratio of rolling resistance consumption total consumption on paved roads. From my Tesla experience I have concluded that f~ 1/3 so I'd plan on range reduction by 1 + 29/3 = 10.7 bringing my 351 mile nominal range down to 33 ± U where I would understand that U can be a pretty big number because I have little confidence that the sand I will drive on will present C = 0.3.
 
Last edited:

Sponsored

Temerarius

Well-Known Member
First Name
Chase
Joined
May 26, 2021
Threads
1
Messages
381
Reaction score
1,196
Location
Kirkland, WA
Vehicles
2017 Tesla Model X, 2018 Ram 1500 EcoDiesel
Occupation
Sr. Program Manager
The battery looks to be not much more than something that made it heavier. Kinda disappointed.
Totally agree.

When I heard about the 4xe and what they were doing, my first reaction was literally "WTF, why would you do this? You now have the complexity of two systems, a bunch of dead weight when one is running, and you have basically destroyed the efficiency gains you get from an electric platform."
 

Yth

New Member
First Name
Paul
Joined
Feb 22, 2021
Threads
0
Messages
1
Reaction score
0
Location
Oregon
Vehicles
Tahoe
OK. Show me where I'm inconsistent and we'll discuss it.

What in heavens name does this have to do with it? I don't have any formal education in transportation systems that involve flying either. This isn't rocket science. It's more simple estimation theory than anything else.

I's this a semantics question? I call what it does "estimating" the SoC at every point along the proposed route. It can and does model certain things, such as speed and the effects of going up or down a hill (that's what cause the little wobbles in the gray line). But there is no way it can know a-priori what the wind will be, whether the road will be wet or not or whether I will drive over or under the speed limit. If you want to call those estimates "predictions" OK, we'll say my Tesla has predicted the consumption at every point along the route. The central point of what I am trying to convey and what the picture from the Tesla shows that the predictions are pretty lousy because actual conditions were different from what was assumed when the Tesla made the prediction.

I'm going to jump to what I thing is at the heart of the discussion.


What we want to predict is SoC at destination. This is relevant before setting out and at every point along the route as we are driving it. This estimate is S = S0 - ∑d_i*w_i in which the sum is over N distance increments the ith of which is d_i (∑d_i = the distance from where we are to the destination) and w_i is what we think the consumption will be in the ith increment and S0 is our current measurement of SoC. But we do not know the true consumption Thus each w_i is the true value of utilization, mu_i, plus an error (uncertainty), u_i. As is usual we assume that the uncertainties are Gaussian random variables distributed about 0 with standard deviations sigma_i. The estimate is then S = S0 - ∑d_i*mu_i - ∑d_i*u_i. This has mean S0 - ∑d_i*mu_i and variance (∑d_i*u_i)^2 which, assuming uncertainties are not correlated, is ∑(d_i*u_1)^2 and the uncertainty in the estimate is then the square roor of this sum. And this is what the whole discussion turns on. The errors RSS. The uncertainty in the estimate depends on the uncertainties in the individual consumption estimates and over how many miles each estimate applies. To give a little perspective on this I looked up some rolling resistance coefficients and assumed that one did a 30 mile drive 20 miles on cement and 10 miles on sand. The numbers are summarized in the spreadsheet below
uncert.png


I used 2500 kg for the weight of the vehicle because that's what my MX weighs. I used 80% uncertainty in C, the coefficient, for a surfaced road because I have seen increases in consumption wet vs dry to suggest that it can vary that much. I used 10% variation in C for sand because I feel that sands's coefficient has to vary by at lest that much depending on how tightly it is packed, whether it is wet or not etc. The essential thing to get here is that sand's C is 30 times that of cements and that, therefore, even a small uncertainty is C can introduce a large uncertainty in consumption and that the nature of the RSS causes that uncertainty to dominate the smooth surface C uncertainty even though the uncertainty in C for the cement is 8 times that for C in sand and we are driving twice as far on cement. The second column has everything the same except that I have cut the uncertainty in Csand about in half in order to get the sand and cement uncertainties equal.

Thus the example shows that if it rains and doubles C for a surfaced road the consequence is an error of about 1.7 kWh or 1.7% of my battery for a 20 mile trip or 17% of it for a 200 mile trip. Thus on surfaced road I can live with 80% uncertainty. In an off road condition where C can evidently get at least as high as 0.3 would be a disaster. We'd need uncertainties better by a factor of about 15. I don't believe that to be possible. Do I believe CV (coefficient of variation) for a practically accessible off road C data base is possible. No, I don't and that is why I am saying that I don't think Rivian will be offering such a thing.

So suppose you are planning a day running around a set of sand dunes. What kind of range should you expect to obtain. You'd better not use the EPA range of the vehicle based on C = .01. You'd better use C = 0.3, 30 times worse and expect mileage to drop by a factor of 1 + (30 - 1)f where f = the ratio of rolling resistance consumption total consumption on paved roads. From my Tesla experience I have concluded that f~ 1/3 so I'd plan on range reduction by 1 + 29/3 = 10.7 bringing my 351 mile nominal range down to 33 ± U where I would understand that U can be a pretty big number because I have little confidence that the sand I will drive on will present C = 0.3.
Nice post. Thank you for modeling this.
 

SeaGeo

Well-Known Member
First Name
Brice
Joined
Jan 12, 2021
Threads
47
Messages
5,237
Reaction score
9,677
Location
Seattle
Vehicles
Xc60 T8
Occupation
Engineer
What in heavens name does this have to do with it?
If I recall correctly, you have stated that you either have a pilots license or fly. Thus the exclusion of flight related transportation.

Primarily though, your response starts off with (what I'm assuming you think is being nice) a statement suggesting I don't have a good grasp of the concepts here, but that you do. You do this a lot. It's very tiresome, and comes of as being quite arrogant. In general I appreciate interacting with you, but this tendency you have annoyed the shit out of me this weekend in particular. I probably should have kept my mouth shut, but it wouldn't hurt to may pause and assume the other person is knows what they're talking about rather than just assuming they don't.

And you're right, it does come down to some pretty basic math and estimating. But you got it in your head that I was implying one thing (roughly speaking that you should be able predict range very accurately for sand), and then you seemingly made the assumption that hadn't thought through the basics of this. There's a fun little example at the end of this that hopefully explains the major point here. It turns out that sometimes you don't have to be particularly accurate when modeling something. Even though you aren't going to be particularly precise (nor accurate) shooting a shotgun, as long as you're pointing it the other direction, I don't care.

But there is no way it can know a-priori what the wind will be, whether the road will be wet or not or whether I will drive over or under the speed limit. If you want to call those estimates "predictions" OK, we'll say my Tesla has predicted the consumption at every point along the route.
You can fairly easily have a reasonable idea. For example, It's August 2nd. The weather report in Seattle is 80 degrees and sunny. You clearly know that it's not going to be 38 degrees and raining with anticipated weather SSE winds.

And this is also where your argument conflicted itself. You said "you can't predict Wh/mi with much accuracy on a particular piece of road until you drive it" and that you "can't predict a storm" or the wind, or if the road is wet. You then noted that Tesla (likely) takes weather into account. If you know you have a 95% chance of rain, odds are that the road will also be wet while it's raining.

Also, yes, some places still oil gravel roads. It's common in parts of Idaho. I honestly don't know how they do that with environmental permitting though.

The essential thing to get here is that sand's C is 30 times that of cements and that, therefore, even a small uncertainty is C can introduce a large uncertainty in consumption and that the nature of the RSS causes that uncertainty to dominate the smooth surface C uncertainty even though the uncertainty in C for the cement is 8 times that for C in sand and we are driving twice as far on cement.
Look at it from another way. I'm not saying to predict it down to the nats ass. But having an *idea* as to the impact of something (and ideally the uncertainty associated with that) is very helpful. I'm saying if a you as a manufacturer *ignores* a major variable, and don't take any form of a shot at modeling it, you're doing a big disservice to the user. Let's take your little spreadsheet and assumed consumption values to model a semi-realistic little trip. Let's pretend your uncertainty values are right, and your model X has a 100 kWh battery.

Using your uncertainty percentage as a proxy for the reasonably distribution of uncerainty (i.e. 2 SD for exampe), it looks like your high end concrete surface consumption would be 197 wh/mi. Right? That model is certainly is efficient ;)! In fact, it's so efficient that we realize you had created some new motors and went into business to make the AJ1T.

For sand the consumption would be nominally 3285.7 wh/mi, and 2957.13 wh/mi on the low end of consumption to 3614.27 wh/mi on the high end.

So let's pretend that the *only* variable is surface type. Weather, speed, and elevation don't matter. And your GOM doesn't incorporate that information at all. So no matter where you go, it assumes you're going to be driving on concrete. Why? Because you don't think you can capture the uncertainty (which is another discussion).

So, our GOM will always say that with a fully charged 100 kWh battery, you can drive 507 miles (but per your numbers up to 4,566 miles. Realitiscally there's a lognormal distribution there and realistically your uncertainty is wrong, but it's funny to see the effect of 80% uncertainty with your model). Doesn't matter if the weather report says there's going to be a hurricane or not. Doesn't matter if the speed limit for the road we expect to drive on is 5 mph or 75 mph. The GOM says you can conservatively make it anywhere within 507 miles of you. I say conservatively because your nominal range is like 900 miles. So you set out to go do some sight seeing and plan to drive from Coos Bay to Cannon Beach and back. Big Goonies fan. The drive is ~400 miles there and back along the coast. You have PLENTY of range.

However, per your stated sand efficiency values, we know that you should be able to go anywhere from 27 to 33 miles (plus/minus 10%).

So get in your brand new AJ1T, it's great, and put in Cannon Beach, and tell it that you want to drive all the way there on the beach. Because it's Oregon, and driving on the beach is tradition. And you start driving, and start burning through your battery. And your GOM is too dumb to use the data it gains to refine it's information. And it's too dumb to account for variables other than SOC, and the model was based on concrete paved surfaces. After just 15 miles of driving, and using ~50% of your battery, the GOM still says you have at least 250 miles of range left. That's with it being a conservative GOM. Remember, your nominal consumption value for concrete really put the AJ1T at 900 miles range. But because the developers of the AJ1T wanted to be conservative in their range estimates (they hired someone from Porsche) they always use the high consumption value of 197 wh/mi instead of the average of 109.5 wh/mi.

So you're driving along and you get to Winchester Bay, 22 miles from Coos Bay. You have 26% of your battery left. But, because the developers of the AJ1T wanted to make the car friendly to new EV users, it only shows range in miles remaining with a shitty little graphic that nobody can tell the difference between 25% and 75% remaining. Because that's what battery graphics do. They suck. Anyway, I digress. With 26% remaining, the AJ1T still says you have 126 miles of remaining range. You're getting worried. And you just drove past a charger in Winchester, but the restraunt nearby sucks, so you decide to drive to Dune City, after all, it's only 20 more miles. You'll have 100 miles remaining once you get to Dune City. So you carry on, trusting the AJ1T to know how far it will travel (or shit yourself that your battery is broken). And then your car stops in-between Winchester and Dune City. 0% battery. There isn't anything around. You're hosed. You call a tow truck. It's 2 pm. They said they'll be there at 9 pm because your AJ1T is heavy, and the nearest truck that can tow it is in Portland and busy. The tide is rising at the mouth of the umpqua river on Wincester bay. When you called for a tow at 2, the tide it was at 2.5 feet. By 8:16 pm it's at 6 feet, and your AJ1T is now floating. Congrats, you now own an AJ1B. You made it less than 10% of your trip before running out of juice.


Rivian R1T R1S Off Road Range for EV? Jeep 4xe Review / Comparison from TFL 1627949739953


I'm obviously having some fun with this a bit, but the point is that by capturing the anticipated conditions (and if you want, training your consumption algorithm on the fly for the real data during a drive) you can make a *better* estimate than by ignoring the variables. Even if they have a high degree of uncertainty. As you've noted, realistically the common variables we run into are things like elevation gain, mass of and in the car, weather conditions, driving speed, driving style, etc. You can create an algorithm that ignores all of the variables like the AJ1T, or you can try to capture them as best you can. If you wanted you could present the expected predicted range assuming you always drive 110% above the stated speed limit and account for all of the anticipated conditions, and then continuously update that prediction based on recent data, and pull in anticipated weather data for a long trip, etc. Is the answer going to be *absolutely* right? No. But is it better than ignoring most or all of the major variables? Almost always. Same with sand or other off road surfaces. The AJ1T ignored all variables to range other than state of charge and it turned into a boat now called the AJ1B. Are you concerned about not being accurate enough and want to account for uncertainty? Be transparent about it and show the best estimate, and some confidence interval or number of SD from the mean on either side so people can see that you'd likely get between.... 507 and 4,566 miles of range per charge with the AJ1T (or example). You can present that uncertainty similar to the uncertainty cone that NOAA produces for hurricane. The further our the prediction, the larger the uncertainty. Similar to this the example chart below. It's pretty obvious when you would hit your sand model, and that it absolutely kills your SOC. But the AJ1T decided to ignore that so it would predict no less than 90% SOC at 100 miles on this chart....
Rivian R1T R1S Off Road Range for EV? Jeep 4xe Review / Comparison from TFL 1627956502013


Merging our story with the approach shown in the figure above, even if you assume sand had an 80% uncertainty, the range on sand would still present the driver between 17 and 152 miles of range to start with a best estimate of 30 miles. I don't know about you, I don't really care about the difference in 17 vs 152 miles when I'm expecting more than 507 miles. Basically the uncertainty in the sand model effectively doesn't matter because the expected consumption difference between the sand and concrete consumption models is so much different.

But if the developers of the AJ1T had made even the *slightest* effort to incorporate the effect that driving on the beach would have on the energy consumption, you would have planned accordingly and stopped at Winchester, or more than likely have bailed on the beach idea and taken a paved road to get up to Cannon Beach.

Which really is my point. The difference in your theoretical sand usage causes a massive hit to the battery, and these vehicles are being marketed to "have adventures" in. Rivian appears to have a lot of miles on unpaved surfaces. They can capture that an expected value and the uncertainty, and address it however they see fit. But just straight up ignoring that data and not trying to account for the surface type is problematic imo given how the vehicle is being targeted. Does it make sense for Tesla to ignore that information? Sure. ABRP? Sure. But if the tools aren't there in the car, and people don't have the same understanding of the effect that off-roading will have on SOC, someone is going to end up with a proverbial AJ1B midway up a trail somewhere and it could have been prevented.
 

Ssaygmo

Well-Known Member
First Name
Sage
Joined
Sep 11, 2020
Threads
3
Messages
123
Reaction score
171
Location
Ca
Vehicles
Volt
this is another review of that 4xe. The battery looks to be not much more than something that made it heavier. Kinda disappointed. I'm not in the market for one, but my 11 yo daughter is big into wanting a Jeep and I've told her has to be full battery :)
Hmm, I'm actually rather impressed with it. Getting 27 miles on road with a battery phev system designed mostly to get a federal rebate and hit mpg targets, covers most peoples daily driving. I drive 9 miles each way, so with 27 total miles I would have a 10 mile buffer and do all my daily driving electric mode. Then I could go and run whatever off-road trails or take a 1000 mile road trip, without worrying about finding a charger somewhere.
 

SeaGeo

Well-Known Member
First Name
Brice
Joined
Jan 12, 2021
Threads
47
Messages
5,237
Reaction score
9,677
Location
Seattle
Vehicles
Xc60 T8
Occupation
Engineer
Hmm, I'm actually rather impressed with it. Getting 27 miles on road with a battery phev system designed mostly to get a federal rebate and hit mpg targets, covers most peoples daily driving. I drive 9 miles each way, so with 27 total miles I would have a 10 mile buffer and do all my daily driving electric mode. Then I could go and run whatever off-road trails or take a 1000 mile road trip, without worrying about finding a charger somewhere.
Same. Getting up to 40 miles would generally cover my commute, but 27 isn't bad. Minus the absolutely abysmal hybrid fuel economy. The difference between the Wrangler, XC60, and RAV4 Prime hybrid efficiencies is astounding at 20/26/40.
 

Sponsored

ajdelange

Well-Known Member
First Name
A. J.
Joined
Aug 1, 2019
Threads
9
Messages
2,883
Reaction score
2,317
Location
Virginia/Quebec
Vehicles
Tesla XLR+2019, Lexus, Landcruiser, R1T
Occupation
EE Retired
Nice post. Thank you for modeling this.
You are most welcome! I happily answer questions like this when I can because I learn about the cars and, more importantly, it helps keep the rust out of the neurons. Finally, this kind of excercise often leads to additional insights and it has already done so here.

We have cars that go 300 - 500 miles on a battery which means each mile is going to use 1/3 to 1/5 of a percent of that battery under normal circumstances (driving on a surfaced road). Let's look at 400 mi to keep this Rivian oriented. That means each percent of the battery delivers 4 miles or that each mile uses 1/4 % of the battery. It's clear that we can only afford to budget say 1/3 of this to rolling resistance. That means (1/3)*(1/4) = (1/12)% = 0.0833% and that (2/3)*(1/4) = (2/12) = 0.01666% of the battery per mile are used for the other loads.

It's pretty simple to calulate the rolling resistance load. It''s m*k*C where m is the mass in kg, k = 1609.34*9.8/3600 and C is the rolling resistance coefficient. Say the R1T weighs about 2500 kg so m*k = 11000 and if the battery is 180 kWh, 1/4 of 1% of that is 1800/4 = 450 Wh/mi and a third of that is 150 Wh/mi leaving 300 Wh/mi for all the other loads. Then C must be C = 150/11000 = 0.014 which is a reasonable value for tires on concrete. Now if C increases by an order of magnitude to C = 0.14 then m*k*C = 1500 Wh/mi and the consumption is now 1500 + 350 = 1850 Wh/mi. The rolling resistance is no longer (1/12)% per mile but (10/12)% and the total consumption ((10 + 2)/12)% = 1% and rolling resistance now dominates the total load being five sixths of it. It has reduced the range of the vehicle from 400 miles to 100/1 = 100 miles. Note from the previous post that sand has a C of about twice 0.14 meaning that the rolling resistance requires (20/12)% to overcome and that total consumption is now ((20 + 2)/12)% = 1.833%/MI of which ten elevenths (91%) are for rolling resistance and the range is 100/1.833 = 54.5 mi.

As to the effect of error in C: Error of 10% when C = 0.14 causes rolling resistance to be (.1/12) greater or smaller than it actually is. This means total consumption is ( (1 ± .1) + 2)/12) = (3 ± .1)/12 %. In a 50 mile trip the consumption uncertainty is 0.1*50/12 = 0.42% of the battery. Not a problem. But when the C = 0.14 10% uncertainty in its value implies consumption of ((10 ± 1) + 2)/12) for uncertainty of 1/12 per mile and, for a 50 mile trip, 50/12 = 4.2% of the battery. In sand, the uncertainty for a 50 mile trip would be 8.4%. Since 50 miles is most of the range of the vehicle in sand this clearly is a problem.
 

ajdelange

Well-Known Member
First Name
A. J.
Joined
Aug 1, 2019
Threads
9
Messages
2,883
Reaction score
2,317
Location
Virginia/Quebec
Vehicles
Tesla XLR+2019, Lexus, Landcruiser, R1T
Occupation
EE Retired
If I recall correctly, you have stated that you either have a pilots license or fly. Thus the exclusion of flight related transportation....
I still don't see what this has to do with anything but my education was EE.

...comes of as being quite arrogant.
I am arrogant.


You can fairly easily have a reasonable idea. For example, It's August 2nd. The weather report in Seattle is 80 degrees and sunny. You clearly know that it's not going to be 38 degrees and raining with anticipated weather SSE winds.
There are places where this works. Easiest job in the world is weatherman for 8HA (central Australia). "The weather in the Alice for the rest of the week will be fine". He'll be 98% accurate year round. Now lets jump cross the seas to Mother England where they say "If you don't like the weather wait 10 minutes."

And this is also where your argument conflicted itself. You said "you can't predict Wh/mi with much accuracy on a particular piece of road until you drive it" and that you "can't predict a storm" or the wind, or if the road is wet. You then noted that Tesla (likely) takes weather into account. If you know you have a 95% chance of rain, odds are that the road will also be wet while it's raining.
The weather may be as different between where you and I live as it is between Alice Springs and York but where I live it is quite variable. It may be raining in the morning and sunny in the afternoon. Especially in summer a sunny day may be interrupted by an intense thunderstorm. These, of course, bring both wind and rain both of which effect consumption.

I don't really know whether Tesla's algorithm includes real time weather or not but the whole point of the picture in No. 31 is that whether they do or not, the prediction on that day was lousy. For some reason the planner thought that I was going to use 325 Wh/mi when in fact I used 274. It is not difficult to see why it might do such a lousy job. In an earlier post I explained how the route planner does its job, that is, by breaking up the trip into small increments, calculating the energy used in each increment and deducting that from the current SoC. To calculate the energy used in an increment the planner needs to calculate 6 loads:

•Heat loss
•Slip loss
•Drag
•Rolling resistance
•Gravity
•Inertia

The entertainment system, lights and HVAC obviously represent additional loads but let's ignore those for now. Each of the 6 loads depends on one or more of the following parameters:

•Vehicle mass
•Vehicle frontal area
•Vehicle drag coefficient
•Gravitational constant
•Drive train efficiency
•Wheel slip (which depends on many of the following factors)
•Air temperature
•Relative humidity or dew point
•Vehicle altitude
•Air density (depends on temperature, humidity and altitude)
•Vehicle true air speed (depends on ground speed and wind speed)
•Wind speed and direction (needed for TAS)
•Grade
•Rolling resistance coefficient
•Weight of vehicle
•Vehicle acceleration.

An uncertainty in any of those parameters will induce an uncertainty in each of the loads which depend on it and thus in the consumption for a distance increment and hence in all the SoC estimates more downrange than the current one.

The final outcome is more sensitive to some of those parameters than others and the uncertainty associated with some of those parameters is much greater than for others. For example if the planner knows the route, and it does, it can go to a data base and look up g, the gravitational constant, for each point along the route besides which g doesn't vary much from point to point.

OTOH consumption is very sensitive to speed as drag load (per mile) is proportional to the square of the speed and it is also very sensitive to rolling coefficient when rolling coefficient gets large. As my previous post shows rolling resistance is generally about 1/3 of the total consumption budget at modest driving speed on prepared roads. As speed goes up that fraction gets smaller as drag grows quadraticaly while rolling load stays pretty much the same. The rolling load goes up dramatically when the coefficient goes up dramatically as it is directly proportional to the coefficient. Off road the coefficient can be 1.3 or more orders of magnitude greater than on. Thus on road the biggest contributors to uncertainty and the reason for the divergence of the lines on the Tesla graph is speed related. There are 2 sources of uncertainty here. The planner cannot know when it makes the plan how fast you are actually going to drive it. It MUST make an assumption about speed in order to compute drag slip and drive line loss. The drivers tendency to drive faster or slower than the profile the planner selects based on speed limit data in its database is, on calm days, the major contributor to plan error. Note that driving slower may not be a choice but forced by traffic. On windy days the uncertainty is exacerbated by the inability to know wind speed and direction at each point along the route. On road water can increase rolling resistance appreciably but as on road the magnitude of rolling resistance is small even doubling C will have an effect which while it is not insignificant is not that large. It can be enough to run you out of juice whatever your original plan told you. If it starts to rain, start to monitor the right end of that graph.


Look at it from another way. I'm not saying to predict it down to the nats ass. But having an *idea* as to the impact of something (and ideally the uncertainty associated with that) is very helpful. I'm saying if a you as a manufacturer *ignores* a major variable, and don't take any form of a shot at modeling it, you're doing a big disservice to the user.
The manufacturer cannot ignore any of the parameters. If he decides, for example, not to include inertial load in his calculation on the assumption that regen recaptures it all he is effectively putting in 0 for acceleration. Acceleration isn't 0 and so he introduces an error when he does this.


Let's take your little spreadsheet and assumed consumption values to model a semi-realistic little trip. Let's pretend your uncertainty values are right, and your model X has a 100 kWh battery.

Using your uncertainty percentage as a proxy for the reasonably distribution of uncerainty (i.e. 2 SD for exampe), it looks like your high end concrete surface consumption would be 197 wh/mi. Right?
Unfortunately, no. To begin the 80% uncertainty was chosen merely for illustration purposes and used to calculate the uncertainty that would induce in the rolling resistance load. It is nothing more that 0.8* 109.5 which is the rolling resistance I calculated for a 2500 kg vehicle using good tyres. I chose 80% because I have seen rolling resistances uncertainty of about 80 Wh/mi when driving in heavy rain and I believe my nominal rr to be about 100 Wh/mi. This is to be interpreted as an uncertainty of +0.8 offered as a means of seeing how much error (and perhaps I should have called it that) such an offset would induce in a calculation based on an assumed value of C = 0.01. Note that nothing has been said about what sort of a population this value might have been drawn from. That comes later if we want to see how the uncertainty is distributed.


That model is certainly is efficient ;)! In fact, it's so efficient that we realize you had created some new motors and went into business to make the AJ1T.
The problem is that you have conflated the rr load with the total load which, for these calculations is 300 wh/mi which is clear from the cell which shows nominal use on concrete of 300*20 = 6000 Wh. But I did mean to go back and edit to explicitly clarify that and it slipped my mind. Sorry about the confusion.

Rivian R1T R1S Off Road Range for EV? Jeep 4xe Review / Comparison from TFL uncert


For sand the consumption would be nominally 3285.7 wh/mi, and 2957.13 wh/mi on the low end of consumption to 3614.27 wh/mi on the high end.
The spreadsheet clearly indicates that the nominal consumption on sand is 3476.2 Wh/mi. Here also the other loads must be included in the total.

So let's pretend that the *only* variable is surface type. Weather, speed, and elevation don't matter. And your GOM doesn't incorporate that information at all. So no matter where you go, it assumes you're going to be driving on concrete. Why? Because you don't think you can capture the uncertainty (which is another discussion).

So, our GOM will always say that with a fully charged 100 kWh battery, you can drive 507 miles (but per your numbers up to 4,566 miles. Realitiscally there's a lognormal distribution there and realistically your uncertainty is wrong, but it's funny to see the effect of 80% uncertainty with your model).
From here on your post sort of veers off because you missed the essential fact that what you assumed to be the total load isn't the total load. And I feel bad about that because it might not have happened had I remembered to post that little bit of explanation.

In any case my estimator does include all the other stuff. It is contained in the 200 Wh per mile which added to the rr gives the total consumption. Thus I have a 100 kWh battery and on dry cement the total consumption is 200 + 100 = 300 for nominal range 100/0.3 = 333 mi. On wet cement the total load is 200 + 180 = 380 for range of 100/0.38 = 263 mi and on sand the total consumption is 200 + 3285.7 = 3485.7 for range of 100/3.4857 = 28.7 miles.

The key to understanding is in the formula
S = S0 - ∑d_i*mu_i - ∑d_i*u_i. This has mean mean = S0 -d_i*mu_i and variance (mean - ∑d_i*mu_i)^2
which, assuming uncertainties are not correlated, is ∑(d_i*sigma_i )^2 and the uncertainty in the estimate is then the square root of this sum. I'm not getting the feeling that you are on board with this.


The difference in your theoretical sand usage causes a massive hit to the battery, and these vehicles are being marketed to "have adventures" in. Rivian appears to have a lot of miles on unpaved surfaces. They can capture that an expected value and the uncertainty, and address it however they see fit. But just straight up ignoring that data ...
The formula makes it clear that if mu_i accurately reflects the load then (mean - ∑d_i*mu_i)^2 gets smaller and the quality of the estimate gets better. If Rivian is going to have an SoC at charge display they are going to have to tell the estimator what value to use for C. If the substrate is the logging trail going through the woods from my house to Claudette's and they tell the estimator to use 0.01 then the answer I get is not going to be very good. The problem is that there is no data base that Rivian can go to get data on the substrate in Simpson's woods.

There is a way around the problem. I believe it to be how Tesla handles this. It is represented in the graph below in which a driver plans a trip from point A to point B 100 miles away. The driver will go travel 25 miles on surfaced road. Fifteen mile in it will start to rain and 25 miles in there is a section under repair which lasts for 10 miles and then he is back on pavement. Just as he reaches the pavement a tail wind springs up. The planner has no way of knowing about any of these events as so uses rated consumption of (1/4)%/mi for the whole trip. This results in the straight line from the starting 90% SoC to the intercept at 100 miles showing 48.2% SoC which is what would be left if one takes 100/4 % from 90%. The heavy red line shows the actual consumption under the assumptions we made for this exercise.

Rather that try to predict things it cannot the estimator uses an exponentially time weighted average of past consumption in it's predictions. This works fine as long as the consumption remains fairly constant (the time weighted averaging takes out little wiggles) so the right end of a line projected forward from any point on the SoC cure to the right vertical axis continues to strike it as 65%. The curve labeled Predicted Arrival SoC gives that intercept and as you can see it stays constant until it starts to rain at 15 miles. The predictor begins to adapt to the new consumption rate and as it does so the intercept point move down, not abruptly, until is sepples at 58% which is what the SoC would be at destination if no furhter disturbances occur.

Rivian R1T R1S Off Road Range for EV? Jeep 4xe Review / Comparison from TFL Display


At 25 miles a major disturbance occurs. He starts driving in loose gravel and rolling resistance zooms to become dominant. The filter detects this pretty quickly and the prediction curves for the remainder of the trip are as shown by the sequence of blue dashed lines. The values of their intercepts are show by the Predicted arrival curve which rapidly drops below 0. He's in trouble. The dashed curves tell him how much farther he has to go before his battery is exhausted.

This is going on too long but I hope it is clear that as soon as he gets back on the road the slopes of the prediction lines start to shallow and shortly after getting back on it predicted rate stabilizes and stays stable for the rest of the trip as long as no other perturbation is encountered.

I'd say this display gives the driver a pretty good picture of where he sits at any point on his journey. I guess that's why Tesla uses it.
 
Last edited:

SeaGeo

Well-Known Member
First Name
Brice
Joined
Jan 12, 2021
Threads
47
Messages
5,237
Reaction score
9,677
Location
Seattle
Vehicles
Xc60 T8
Occupation
Engineer
There are places where this works. Easiest job in the world is weatherman for 8HA (central Australia). "The weather in the Alice for the rest of the week will be fine". He'll be 98% accurate year round. Now lets jump cross the seas to Mother England where they say "If you don't like the weather wait 10 minutes."
I've literally lived in those places, and most places I've lived in also say the same thing. In the end, generally speaking, a same day weather report is better than nothing.

I don't really know whether Tesla's algorithm includes real time weather or not but the whole point of the picture in No. 31 is that whether they do or not, the prediction on that day was lousy.
The difference you showed isn't what I'd call "lousy." It's also better than if you had been driving that entire route on your theoretical sand, as we're discussing.

The final outcome is more sensitive to some of those parameters than others and the uncertainty associated with some of those parameters is much greater than for others.
No shit. Hence advocating for accounting for a parameter that is going to have a major impact on battery consumption. You don't see me arguing to account for the change in g as a function of elevation.
The planner cannot know when it makes the plan how fast you are actually going to drive it. It MUST make an assumption about speed in order to compute drag slip and drive line loss. The drivers tendency to drive faster or slower than the profile the planner selects based on speed limit data in its database is, on calm days, the major contributor to plan error. Note that driving slower may not be a choice but forced by traffic. On windy days the uncertainty is exacerbated by the inability to know wind speed and direction at each point along the route. On road water can increase rolling resistance appreciably but as on road the magnitude of rolling resistance is small even doubling C will have an effect which while it is not insignificant is not that large. It can be enough to run you out of juice whatever your original plan told you. If it starts to rain, start to monitor the right end of that graph.
The planner can actually make an informed guess as to the driver's speed with both live traffic data ( for example if traffic sucks, you're not gonna go 75. If the flow of traffic is 80 in a 70, it can also assume that). It can also refine that based on a drivers tendency to drive relative to the speed limit. Whether it does or not is an argument of relatively small refinement. I'm not arguing for small refinements here. I fully get the impact of 35 vs 30 and 77 vs 70. That being said, I agree, that's the major source of error on well behaved roads. Assuming the planner accounts for anticipated weather conditions and elevation change. Some planner's don't. Some do.

Wind is not an unknown unknown. It's a known with some degree of uncertainty. Weather forecasts within an hour generally aren't going to say you have calm winds and then you run into 30 mph head winds. Generally.

There's also nothing precluding a planner from continuously updating it's prediction. Not really the point here though.

"it starts to rain, start to monitor the right end of that graph." That's basically my point with going off pavement. There's nothing precluding a planner for accounting for hitting a surface with a high rolling resistance.
The manufacturer cannot ignore any of the parameters. If he decides, for example, not to include inertial load in his calculation on the assumption that regen recaptures it all he is effectively putting in 0 for acceleration. Acceleration isn't 0 and so he introduces an error when he does this.
You're literally arguing for them to ignore the driving surface.

Also, they can. You seem to prefer not trying to account for weather because you seem to think that it's unknowable. I would argue to include continuously updated prediction of anticipated weather.

Unfortunately, no. To begin the 80% uncertainty was chosen merely for illustration purposes and used to calculate the uncertainty that would induce in the rolling resistance load. It is nothing more that 0.8* 109.5 which is the rolling resistance I calculated for a 2500 kg vehicle using good tyres.
Yes. We're working with your numbers. Whether we use rolling resistance or the total nominal load (which you didn't actually explicitly state) is relatively trivial here.
The problem is that you have conflated the rr load with the total load which, for these calculations is 300 wh/mi which is clear from the cell which shows nominal use on concrete of 300*20 = 6000 Wh.
No. I isolating the primary variable here to show the impact on the individuals, and you didn't actually state your nominal load. We can work of total nominal load if you want now that you've stated it clearly.

The spreadsheet clearly indicates that the nominal consumption on sand is 3476.2 Wh/mi. Here also the other loads must be included in the total.
It actually doesn't. It literally doesn't show 300 wh/mi or 3476.2 wh/mi anywhere. It shows total energy used, over a distance traveled. So I could back calculated your total nominal energy consumption rate, but it doesn't actually show either anywhere. We can work with that if you want though.

Rivian R1T R1S Off Road Range for EV? Jeep 4xe Review / Comparison from TFL 1628049100949


The spreadsheet clearly indicates that the nominal consumption on sand is 3476.2 Wh/mi. Here also the other loads must be included in the total.
Your additional load on top of RR appears to be 190 wh/mi. It's not going to significantly change this exercise. That you don't get this leads me to believe you're intentionally being obstinate.

From here on your post sort of veers off because you missed the essential fact that what you assumed to be the total load isn't the total load. And I feel bad about that because it might not have happened had I remembered to post that little bit of explanation.
Not really. Really quickly speaking, working with your total nominal values the range on concrete for a 100 kwh battery would be:
On concrete: 333 miles
On Sand: 28 miles.

Your AJ1T still turned into an AJ1B because you refused to account for any concept of pavement and you are getting stuck on literally small details rather than concepts. Go back and reread the allegory of AJ1T the SUV that became the AJ1B with your total consumption values used instead. 333 vs 500+ and 28 vs 30 miles doesn't change the answer.


The key to understanding is in the formula
S = S0 - ∑d_i*mu_i - ∑d_i*u_i. This has mean mean = S0 -d_i*mu_i and variance (mean - ∑d_i*mu_i)^2
which, assuming uncertainties are not correlated, is ∑(d_i*sigma_i )^2 and the uncertainty in the estimate is then the square root of this sum. I'm not getting the feeling that you are on board with this.
No, I get it.

At the end of the day, whether you assume uncertainties for each interval are correlated or not doesn't matter in this example. Because that's not the point. The point is by not even making an attempt to account for the uncertainty associated with different driving surfaces for a vehicle that's literally advertised for offroad adventures is burying ones head in the sand.

That being said, some of the uncertainty for each mile is going to be correlated, and some isn't. Those can be mostly separated out with some work, but that's not the actual issue here.

If the substrate is the logging trail going through the woods from my house to Claudette's and they tell the estimator to use 0.01 then the answer I get is not going to be very good. The problem is that there is no data base that Rivian can go to get data on the substrate in Simpson's woods.
Sure there is. At least with a reasonable degree of confidence for mapped roads. Waze even has a toggle to avoid dirt roads. That would cover... idk, damn near every mapped road in the Country including forest service roads and gravel roads in the middle of South Dakota.
Rivian R1T R1S Off Road Range for EV? Jeep 4xe Review / Comparison from TFL 1628049059389


So, what happens if you plan to drive on the beach like in my example? What ever is Rivian to do? Well, that's for them to figure out, but at an absolute minimum I would start with assuming that planning a routeon an area that's not a mapped road or parking lot is *not paved*. Then, use whatever data they want for the rolling resistance of the R1 on unpaved surfaces.

This would be improved. Rivian could prompt the user to clarify the anticipated driving conditions when you map offroad. Or they could simply have a toggle for a planned route that allows you to include X miles of offroading on Y conditions, and that could be incorporated into the route planner without having to actually map the offroad route a-priori within the mapping system.


There is a way around the problem. I believe it to be how Tesla handles this. It is represented in the graph below in which a driver plans a trip from point A to point B 100 miles away. The driver will go travel 25 miles on surfaced road. Fifteen mile in it will start to rain and 25 miles in there is a section under repair which lasts for 10 miles and then he is back on pavement. Just as he reaches the pavement a tail wind springs up. The planner has no way of knowing about any of these events as so uses rated consumption of (1/4)%/mi for the whole trip. This results in the straight line from the starting 90% SoC to the intercept at 100 miles showing 48.2% SoC which is what would be left if one takes 100/4 % from 90%. The heavy red line shows the actual consumption under the assumptions we made for this exercise.
There's a bunch of ways to train the prediction based on the historic data of a drive (or several drives). It's clear that the Tesla is at least accounting for elevation changes. This works for the unknowns of a trip, but it obviously doesn't help with things that can reasonably be predicted. For example, if Tesla's planner didn't account for elevation change, and it assumes 1/4%/mi no matter what, and you route out going up Loveland Pass from Denver. It's a 60 mile drive. You'd assume you're good to go with just 15% SOC. But it's also an elevation gain of 9,000 feet. You aren't going to get there with that, and Tesla accounts for that. So does ABRP. What I'm suggesting is literally the same approach. When you know you're going planning to leave paved surfaces, attempt to account for that because it can be an absolutely massive hit to efficiency as your example number show.
 

Babbuino

Well-Known Member
First Name
Manuel
Joined
Aug 1, 2020
Threads
20
Messages
1,232
Reaction score
2,511
Location
Florida
Vehicles
Audi A3
Occupation
DESIGN engineer
Defender with bigger tires
Sponsored


Top