Budman
Well-Known Member
- Thread starter
- #1
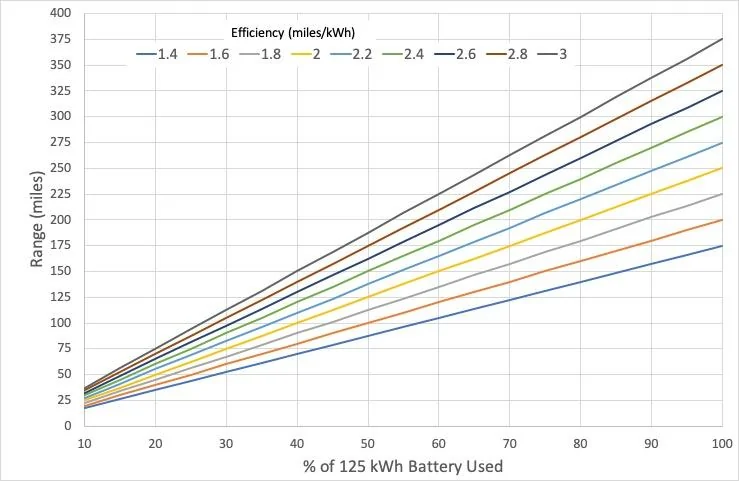
I'm sure many have already made a chart like this but in case you haven't here is a useful chart to have on hand. It quickly shows how far you can go using X% of your battery capacity for different levels of efficiency.
For example, if you are at 90% SOC and willing to go down to 10% SOC on a trip you will be consuming 80% of the total battery capacity. If you efficiency is 2.4 mi/kWh you can go 240 miles. Alternately, say you want to add 100 miles of range and your efficiency has been 2.4 mi/kWh you would need to add about 33% to the battery state of charge.
This chart assumes the usable battery capacity is 125 kWh.
Sponsored
