Budman
Well-Known Member
- Thread starter
- #1
UPDATED ~Sept 1, 2024:
* Originally posted in June with 2 months of data. Updated charts around Sept 1st to now show a 5 month trend line.
* Sept Update Notes:
- The Plugshare averages show consisted difference by region.
- Generally steady or decreasing scores across all regions, no region showed improvement in the 5 month trendlines.
- Perhaps a season trend seen with lower scores in the hottest months, will be more clear as we head to fall and winter.
* Disclaimers on charts:
- I'm limited in Plugshare to define a rectangular area for the geographic region, so some areas of the US and even entire states get left out.
- The date for the data summarization is approximately the 1st of every month but could be +/- 5 days from the 1st.
Original Post: (charts have been replaced with the new Sept 1 update)
The Elon Musk Supercharger team hack job motivated me to become more interested in the performance of Electrify America, the 2nd largest nation wide fast charging network. Anecdotal reports suggest the reliability has improved recently. I'm not a fan of anecdotal, I wanted something a bit more quantifiable.
As imperfect as it is, PlugShare is our best resource to judge charger reliability. I partitioned the United States into 9 regions and used the PlugShare score filter to get the number of stations with scores of 10, 9, 8 etc. I did this on or around the 1st of May and 1st of June. I plan to continue doing this on the first of the month into the future. Hopefully people find it useful and maybe applies a little more consumer pressure on EA to continue striving for better reliabilty.
A lot of graphs below.
The top line result is shown here; the average PlugShare score by region. A lot of regional variability..... The central US and Mountain regions fares well while Southern California not so much. As a resident of the Upper Midwest this make sense, as everything is better in the Upper Midwest.... But I suppose you could argue that the equipment in Southern California is older on average and gets heavier use so is more likely to malfunction. But I will stick with "Everything is just better in the Upper Midwest".

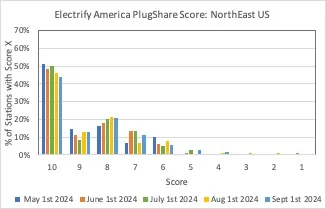
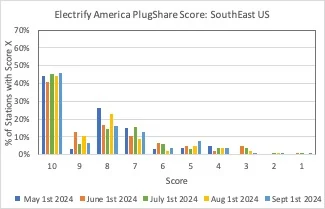
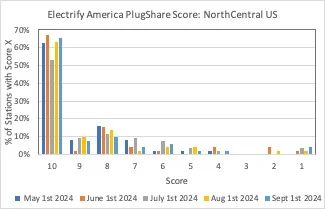
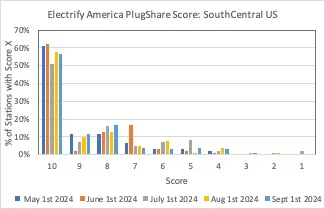
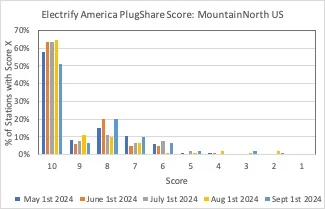
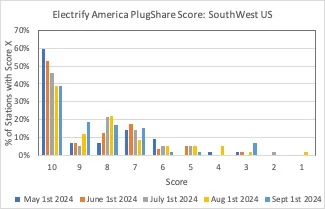
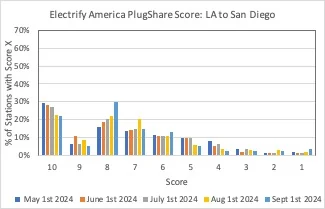
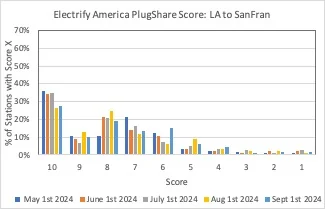
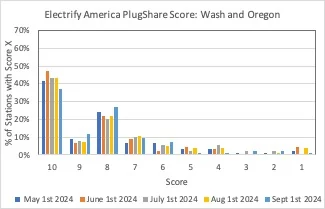
Next are charts showing the percent of stations in a given region getting PlugShare score of 10, 9, 8, etc.


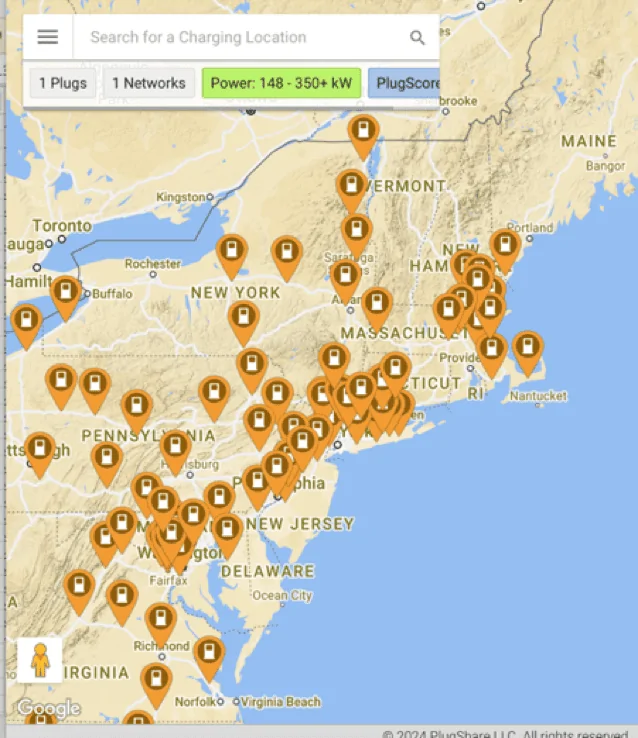
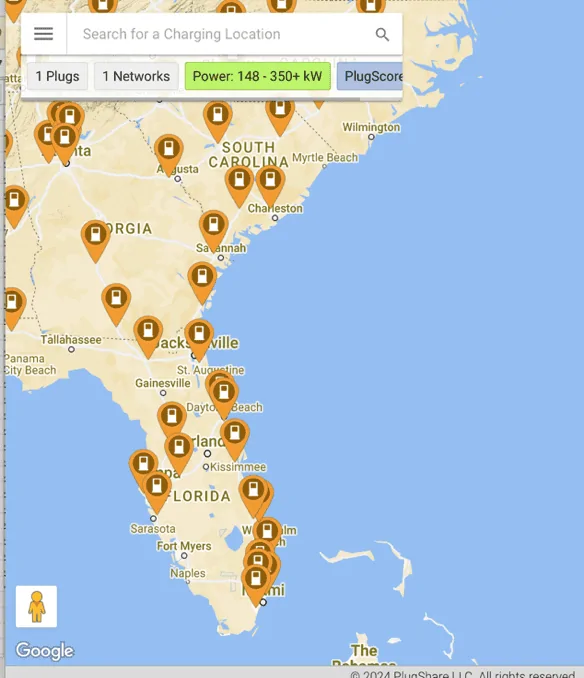
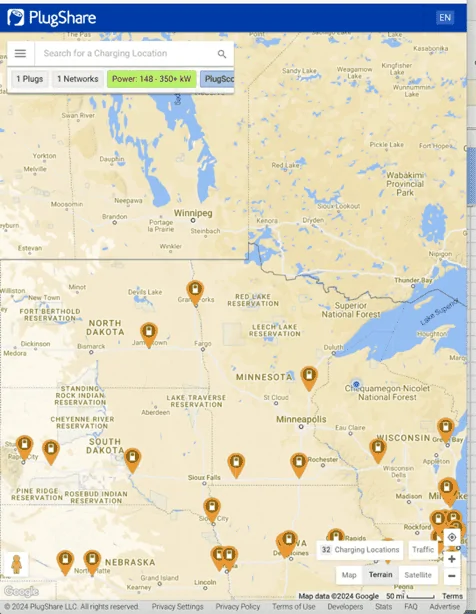
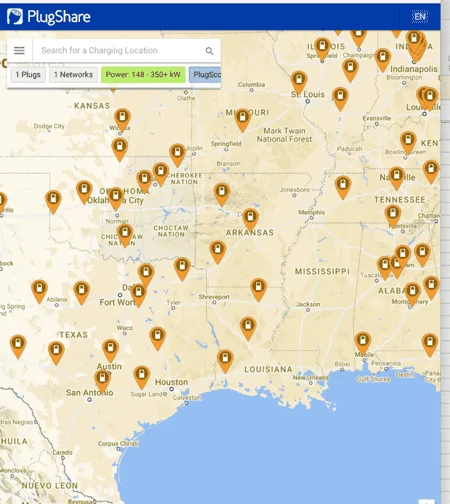
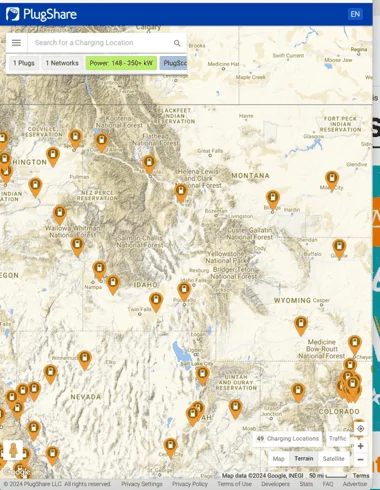
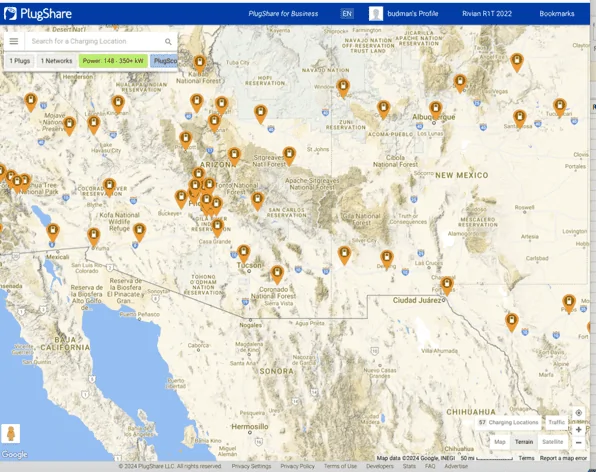
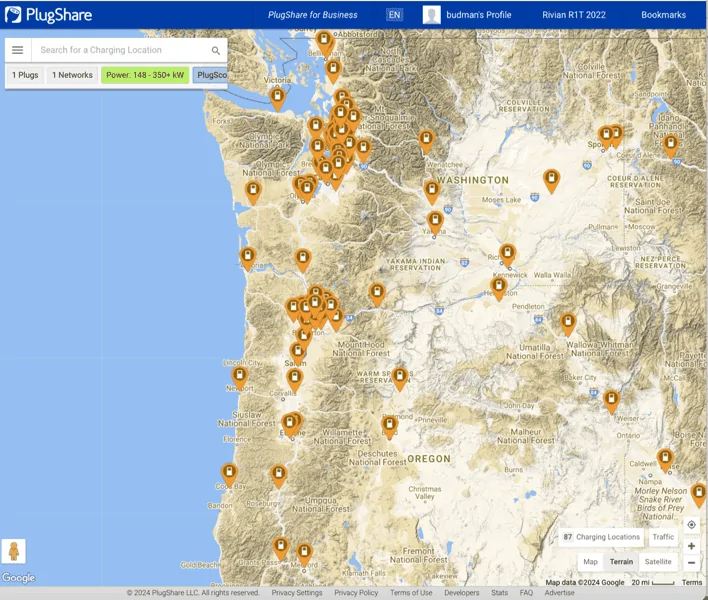
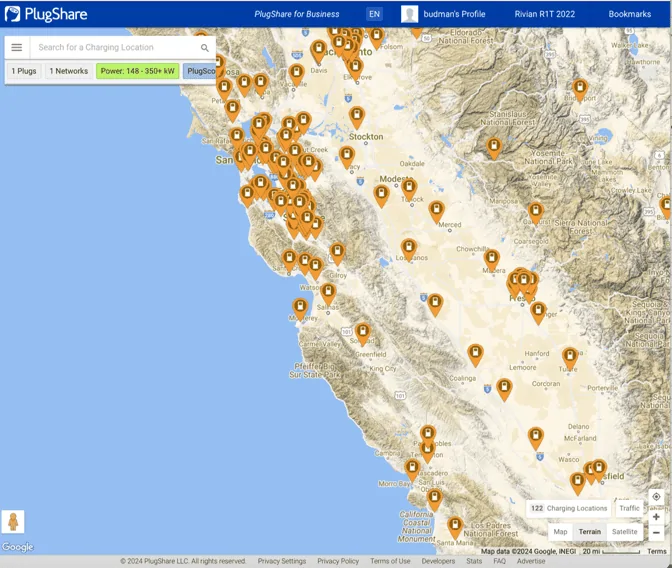
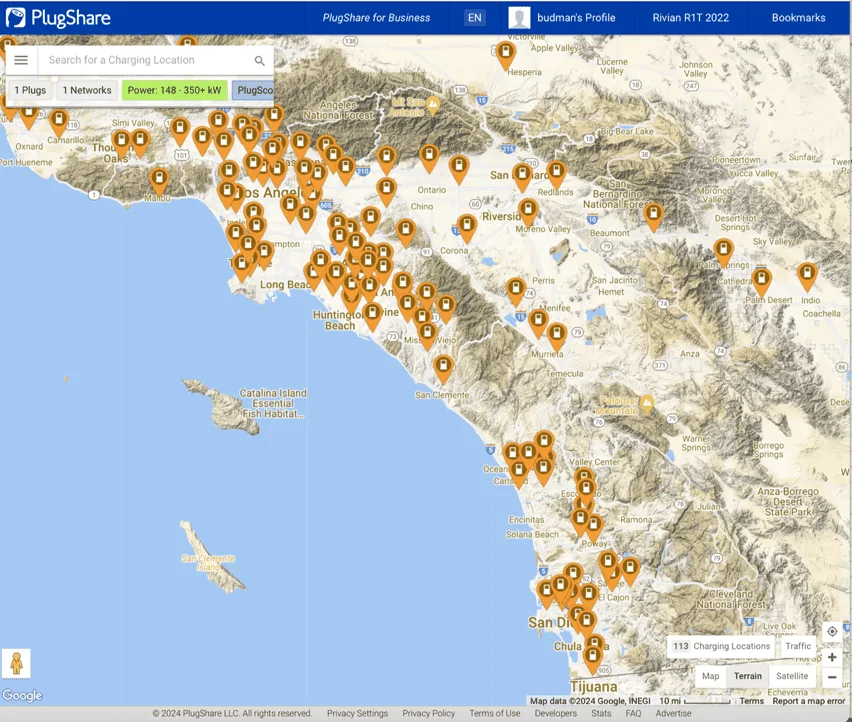
Lastly, screen shots of the PlugShare page showing the boundaries of the regions I'm using;
NorthEast Region

SouthEast Region:

NorthCentral Region;

SouthCentral Region:
 \
\
Mountain North:

SouthWest Region:

Washington and Oregon:

SF to LA:

LA to SD:

* Originally posted in June with 2 months of data. Updated charts around Sept 1st to now show a 5 month trend line.
* Sept Update Notes:
- The Plugshare averages show consisted difference by region.
- Generally steady or decreasing scores across all regions, no region showed improvement in the 5 month trendlines.
- Perhaps a season trend seen with lower scores in the hottest months, will be more clear as we head to fall and winter.
* Disclaimers on charts:
- I'm limited in Plugshare to define a rectangular area for the geographic region, so some areas of the US and even entire states get left out.
- The date for the data summarization is approximately the 1st of every month but could be +/- 5 days from the 1st.
Original Post: (charts have been replaced with the new Sept 1 update)
The Elon Musk Supercharger team hack job motivated me to become more interested in the performance of Electrify America, the 2nd largest nation wide fast charging network. Anecdotal reports suggest the reliability has improved recently. I'm not a fan of anecdotal, I wanted something a bit more quantifiable.
As imperfect as it is, PlugShare is our best resource to judge charger reliability. I partitioned the United States into 9 regions and used the PlugShare score filter to get the number of stations with scores of 10, 9, 8 etc. I did this on or around the 1st of May and 1st of June. I plan to continue doing this on the first of the month into the future. Hopefully people find it useful and maybe applies a little more consumer pressure on EA to continue striving for better reliabilty.
A lot of graphs below.
The top line result is shown here; the average PlugShare score by region. A lot of regional variability..... The central US and Mountain regions fares well while Southern California not so much. As a resident of the Upper Midwest this make sense, as everything is better in the Upper Midwest.... But I suppose you could argue that the equipment in Southern California is older on average and gets heavier use so is more likely to malfunction. But I will stick with "Everything is just better in the Upper Midwest".
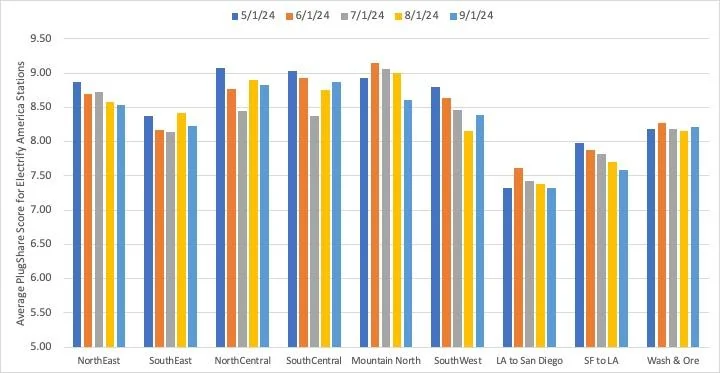
Next are charts showing the percent of stations in a given region getting PlugShare score of 10, 9, 8, etc.
Lastly, screen shots of the PlugShare page showing the boundaries of the regions I'm using;
NorthEast Region
SouthEast Region:
NorthCentral Region;
SouthCentral Region:
Mountain North:
SouthWest Region:
Washington and Oregon:
SF to LA:
LA to SD:
Sponsored
Last edited: