Scott
Well-Known Member
- First Name
- Scott
- Joined
- Sep 16, 2021
- Threads
- 7
- Messages
- 363
- Reaction score
- 744
- Location
- Portland, OR
- Vehicles
- Subaru Forester, VW ID.4, R1S on preorder
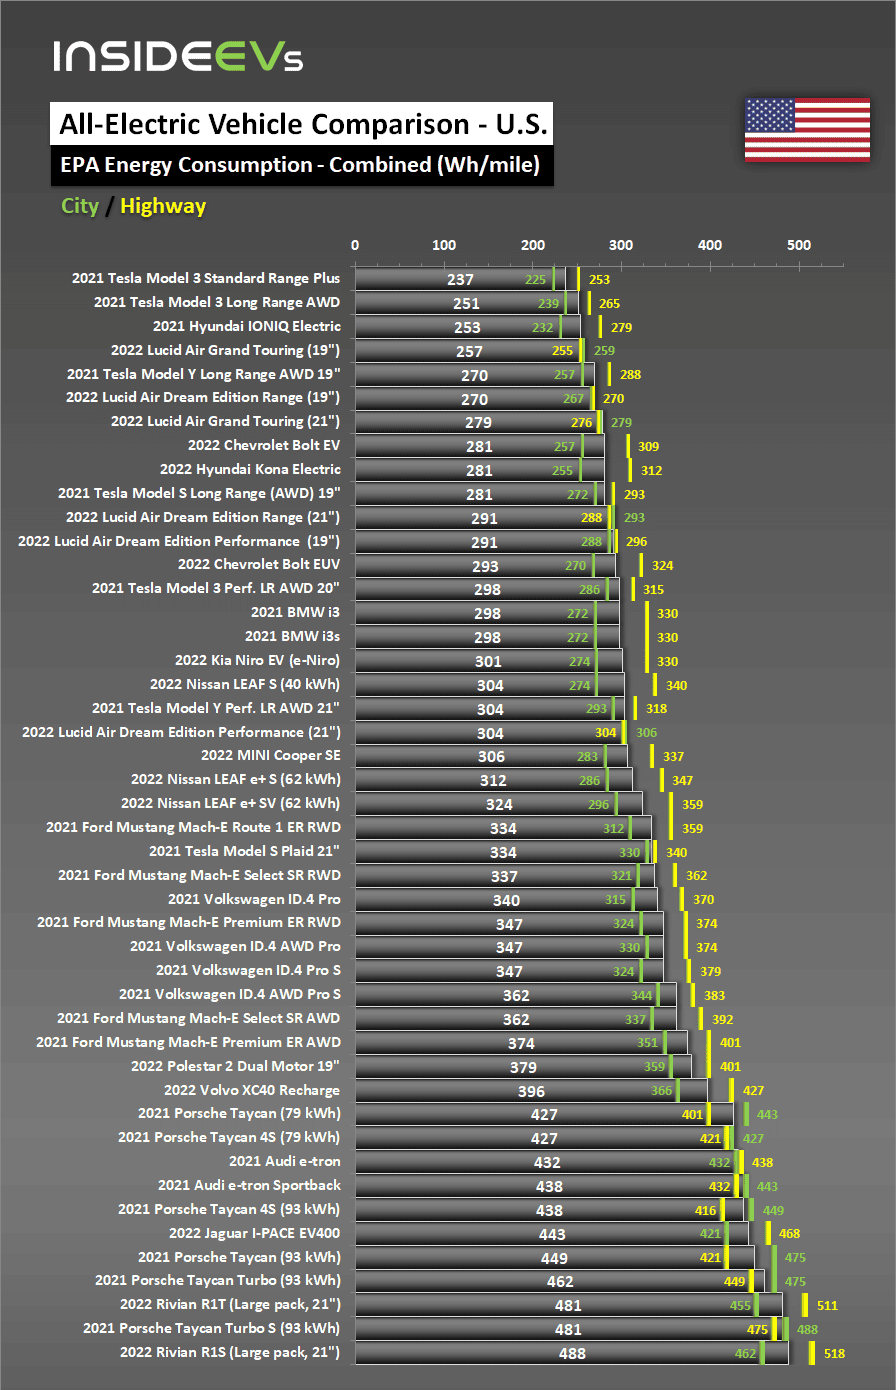
100%. Looking at the Taycan Turbo S and comparing it to the Tesla Model S Plaid and the Lucid Air Dream Edition Performance is a head-scratcher. I know Porsche purposely took a very conservative evaluation and many owners see really significantly better results but I still think it shows that the big automakers are struggling, at least for now, against the EV-specific builders.
Take a look at https://www.edmunds.com/car-news/electric-car-range-and-consumption-epa-vs-edmunds.html
2020 Porsche Taycan 4S: 32.3 kWh/ 100 mi in real world testing
2021 Tesla Model S Plaid: 32.1 kWh/ 100 mi in real world testing
That site doesn't have the turbo S, but the Porsche they did test bested EPA estimates by 34%. Tesla's cars are definitely efficient, but the real world lead is not as big as the EPA numbers make them out to be. For most consumers it likely will not factor in to decision making.
Sponsored
Last edited:
")