Keith Stevenson
Active Member
- First Name
- keith
- Joined
- Nov 26, 2023
- Threads
- 2
- Messages
- 25
- Reaction score
- 13
- Location
- Greenville SC
- Vehicles
- R1T
- Thread starter
- #1
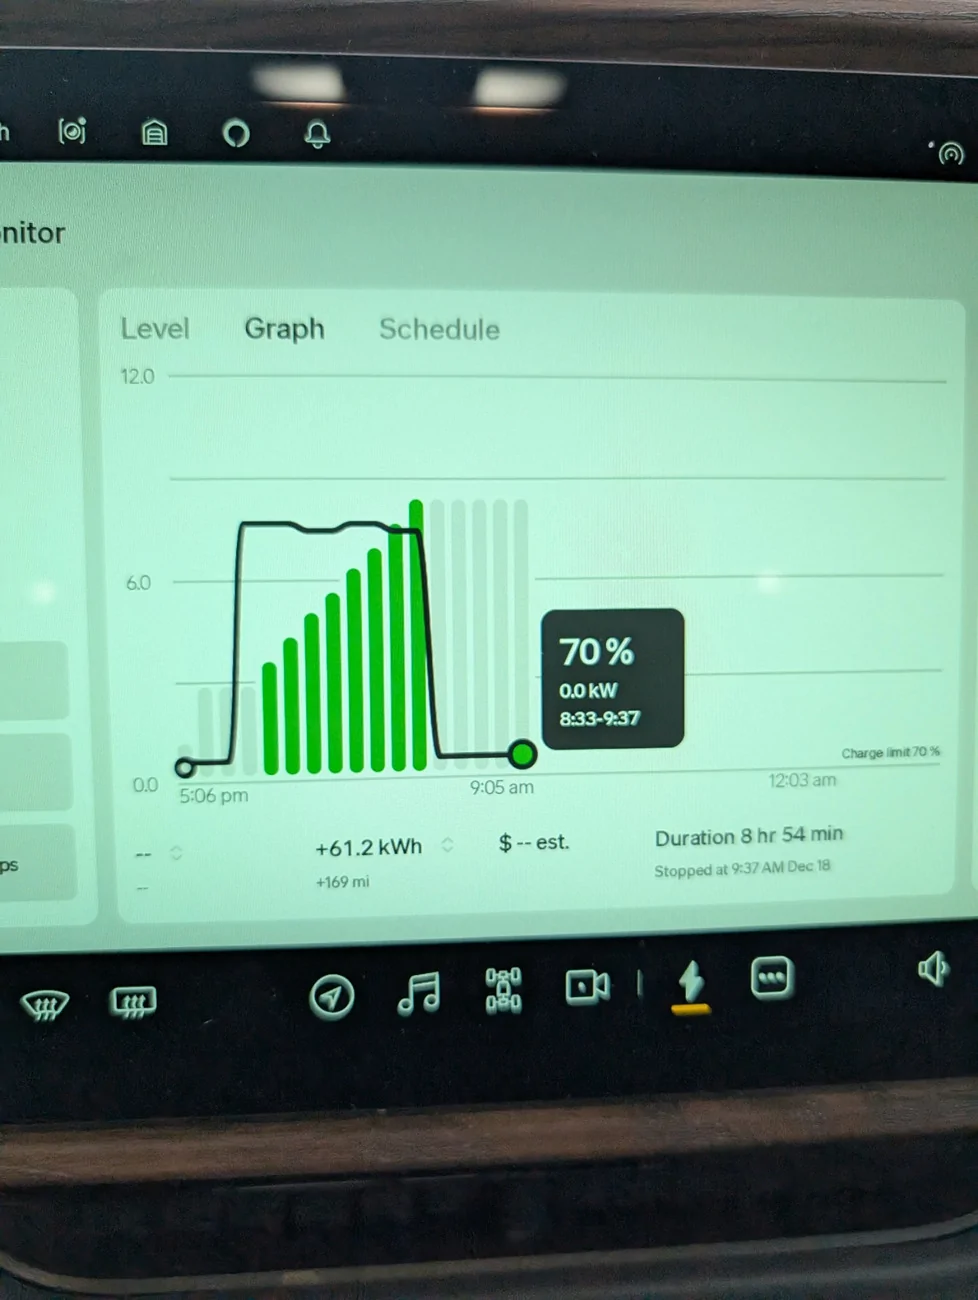
Can someone help me understand the value of this graph? And, what are the units on the Y-axis?

Sponsored