Budman
Well-Known Member
- Thread starter
- #1
This trip/efficiency report will be mostly pictures and graphs and short on words. The graphs are pretty darn good and tell the story better than words could.
We drove our R1T Quad Motor with 21" road tires from Minneapolis to Sedona to do some hiking by way of Des Moines, Omaha, Denver, Sante Fe. Took 4 days on the way out with over night stops in western Nebraska, Colorado Springs, Sante Fe. The way out was kinda cold and snowy so followed a very conservative charging plan with short stints and keeping the battery pretty full. Spend 1 week in Sedona enjoying the hiking then did the return trip in 3 days with stops in Sante Fe and western Nebraska again.
Used mostly Electrify America with no issues except for an ice covered plug in Trinidad, CO that would not engage. Moved to another charger and it worked fine. Overall a very uneventful trip charging wise. As many have noted previously, a long road trip with an EV is actually enjoyable when you can take regular mental and physical breaks at the charging stops vs hammering with non-stop driving in an ICE. We enjoyed the trip and would absolutely to it again in the Rivian. In fact, we are planning an even longer trip to British Columbia this summer.
We took a lot of efficiency data during the trip. Every 50 miles we reset the trip meter and recorded consumption, efficiency, air temperature, wind speed, starting and ending elevation, and average speed. We only did this while on the freeway traveling at 75 mph. Anytime we were in a metro area like Denver with slower speed limits we did not collect data. So we have 52 individual data points from these 52 50-mile segments. Very detailed graphs and correlations to temperature and elevation change below; From Minneapolis to Colorado Springs I was in Conserve Mode but in the mountainous area between Colorado Springs and Sedona I was in All Purpose. But before we get to the data and graphs.......
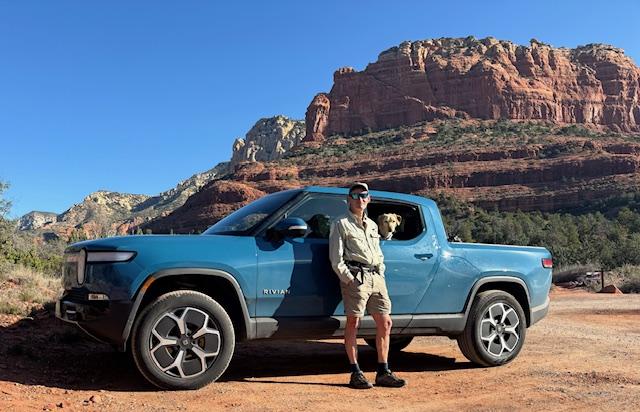
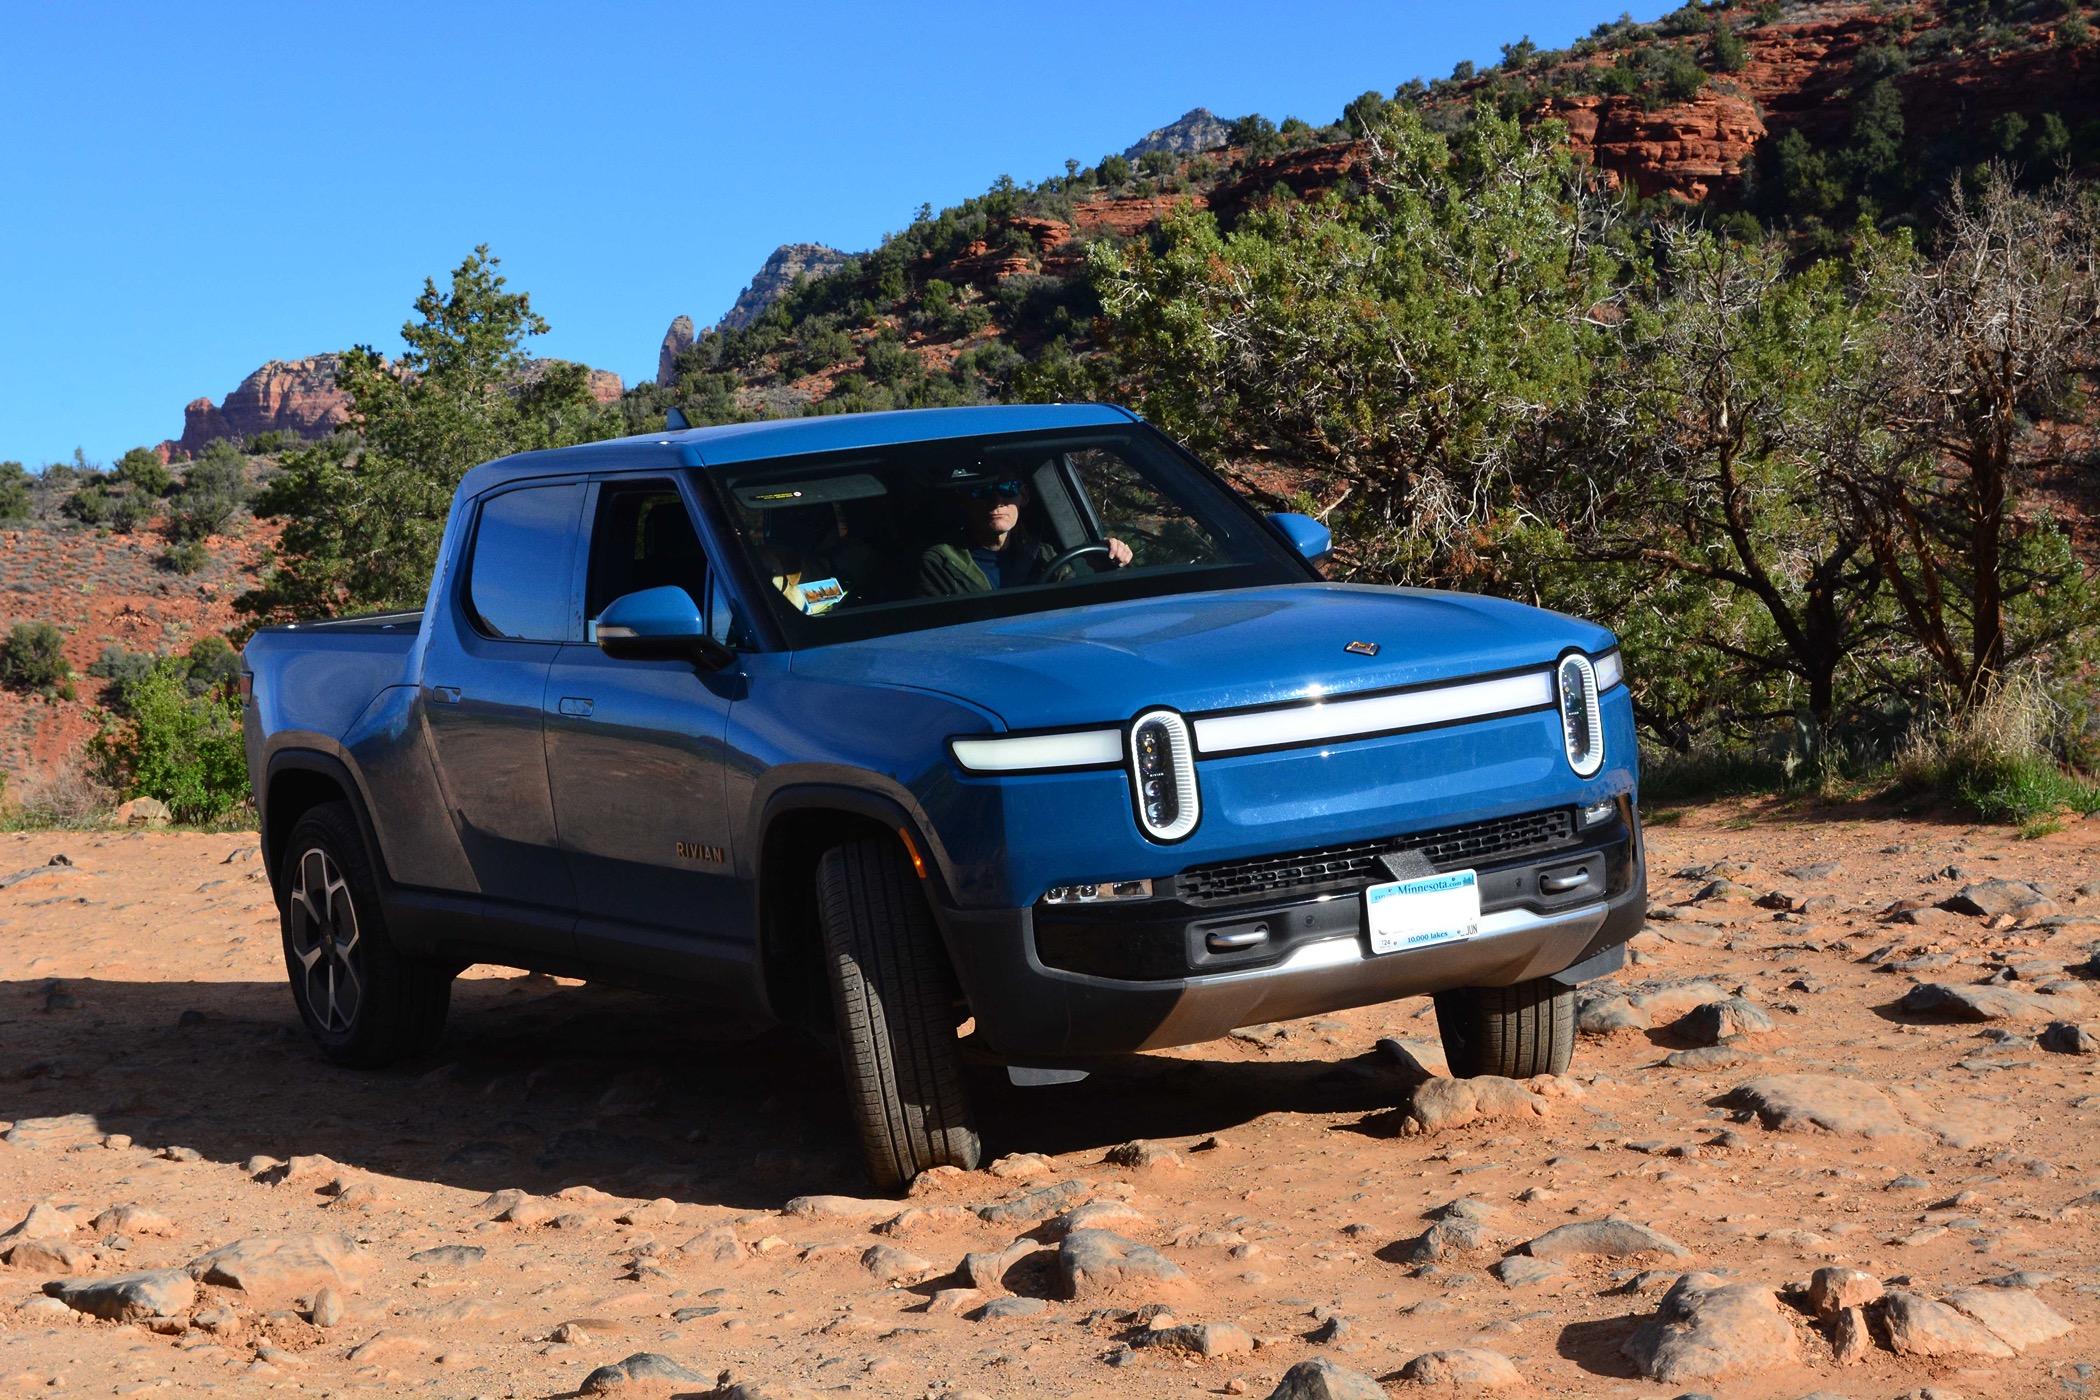
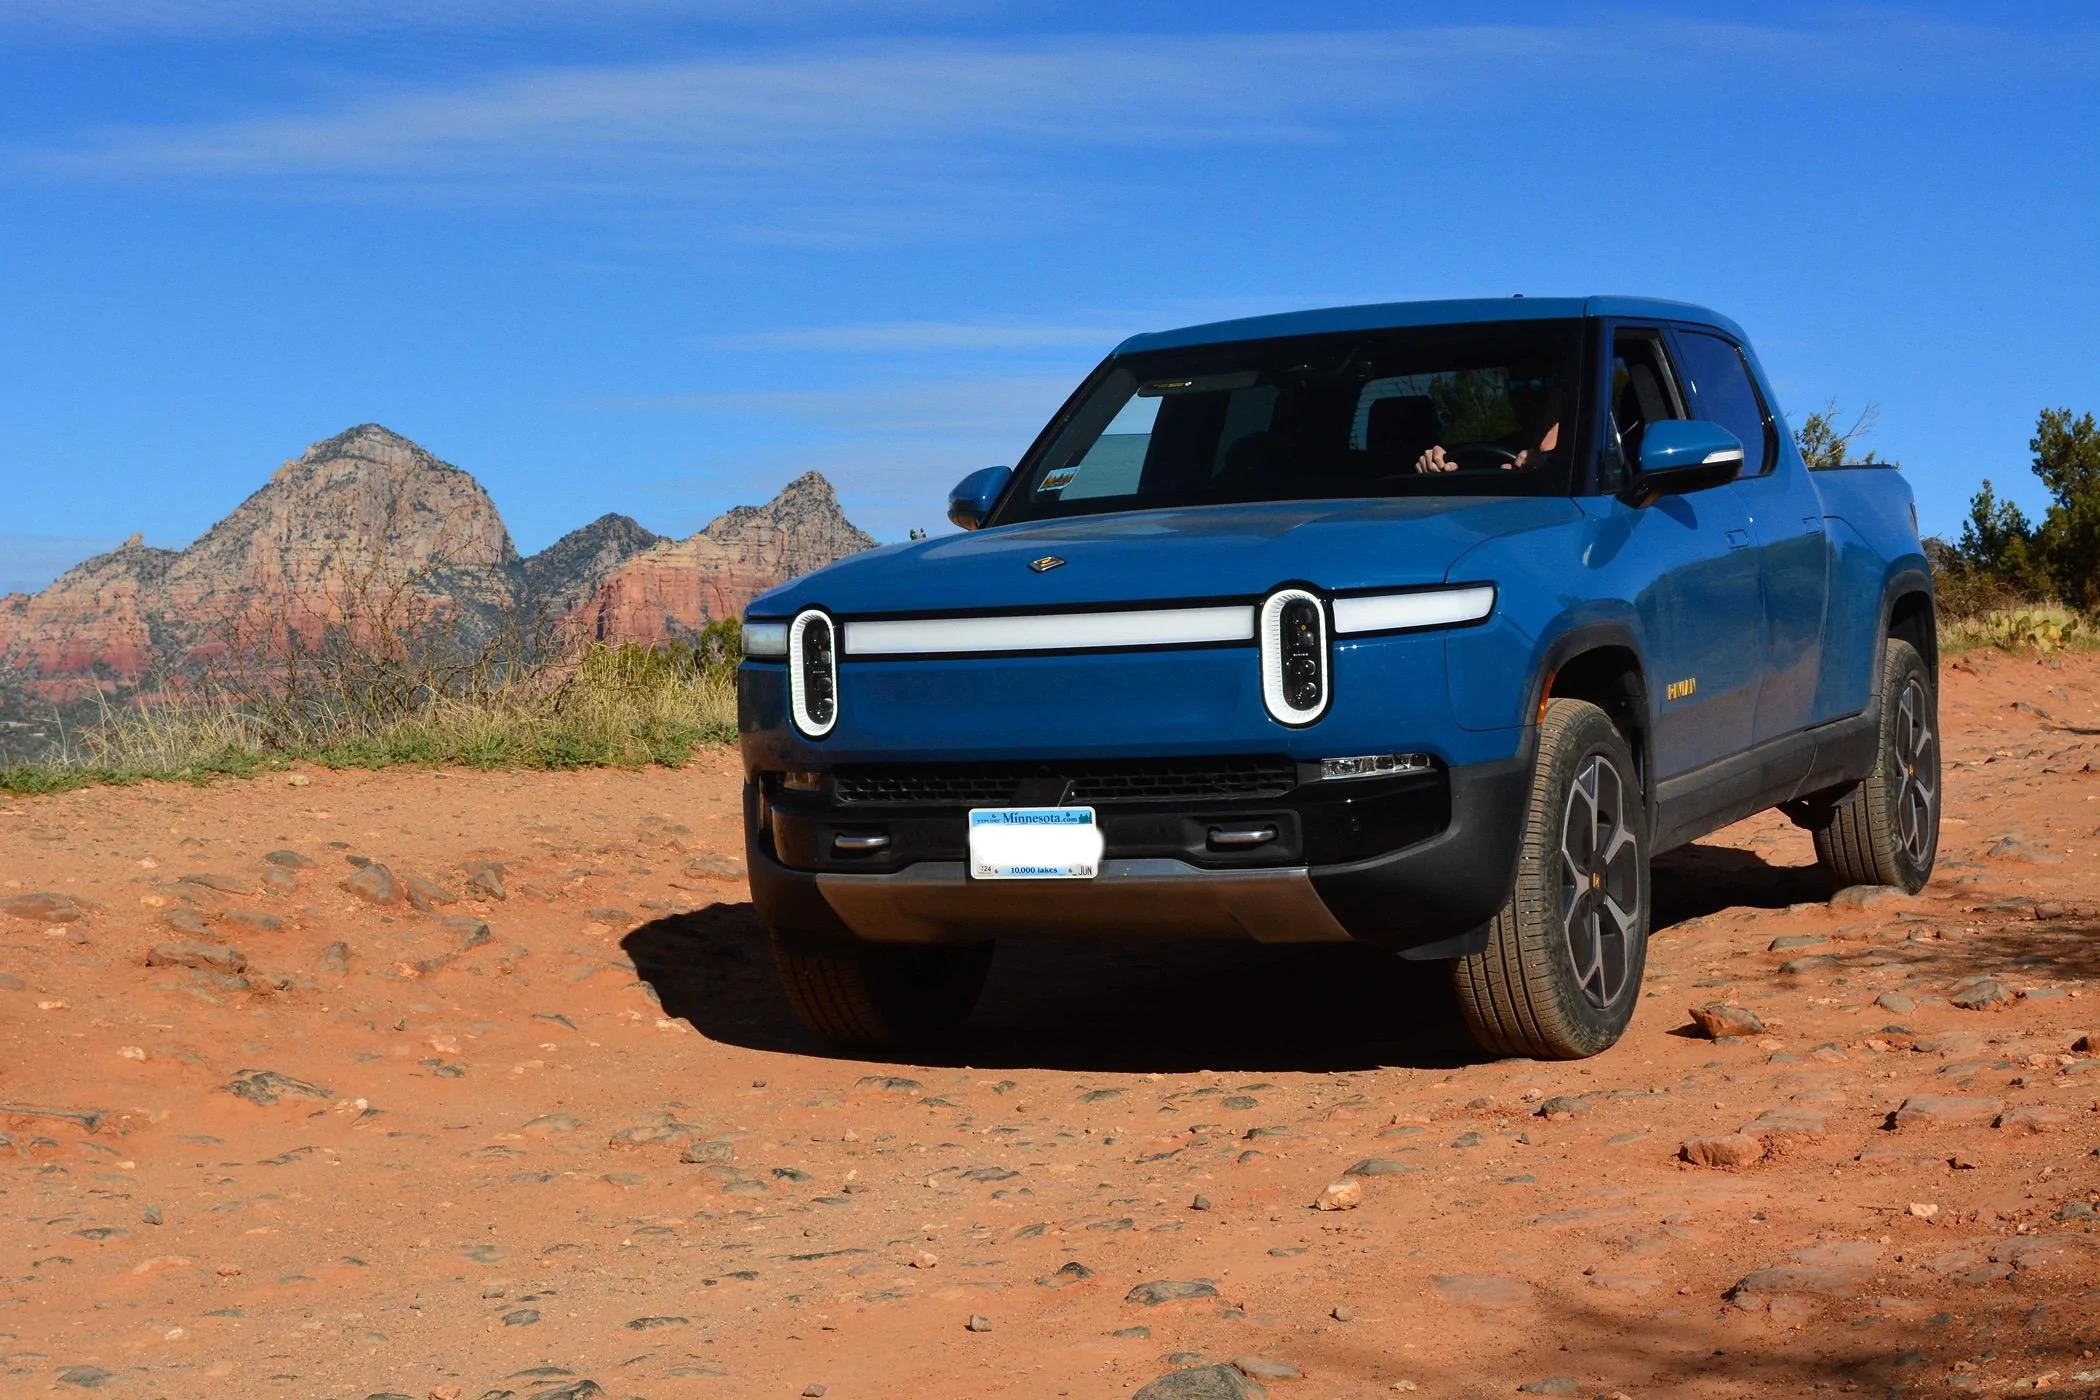
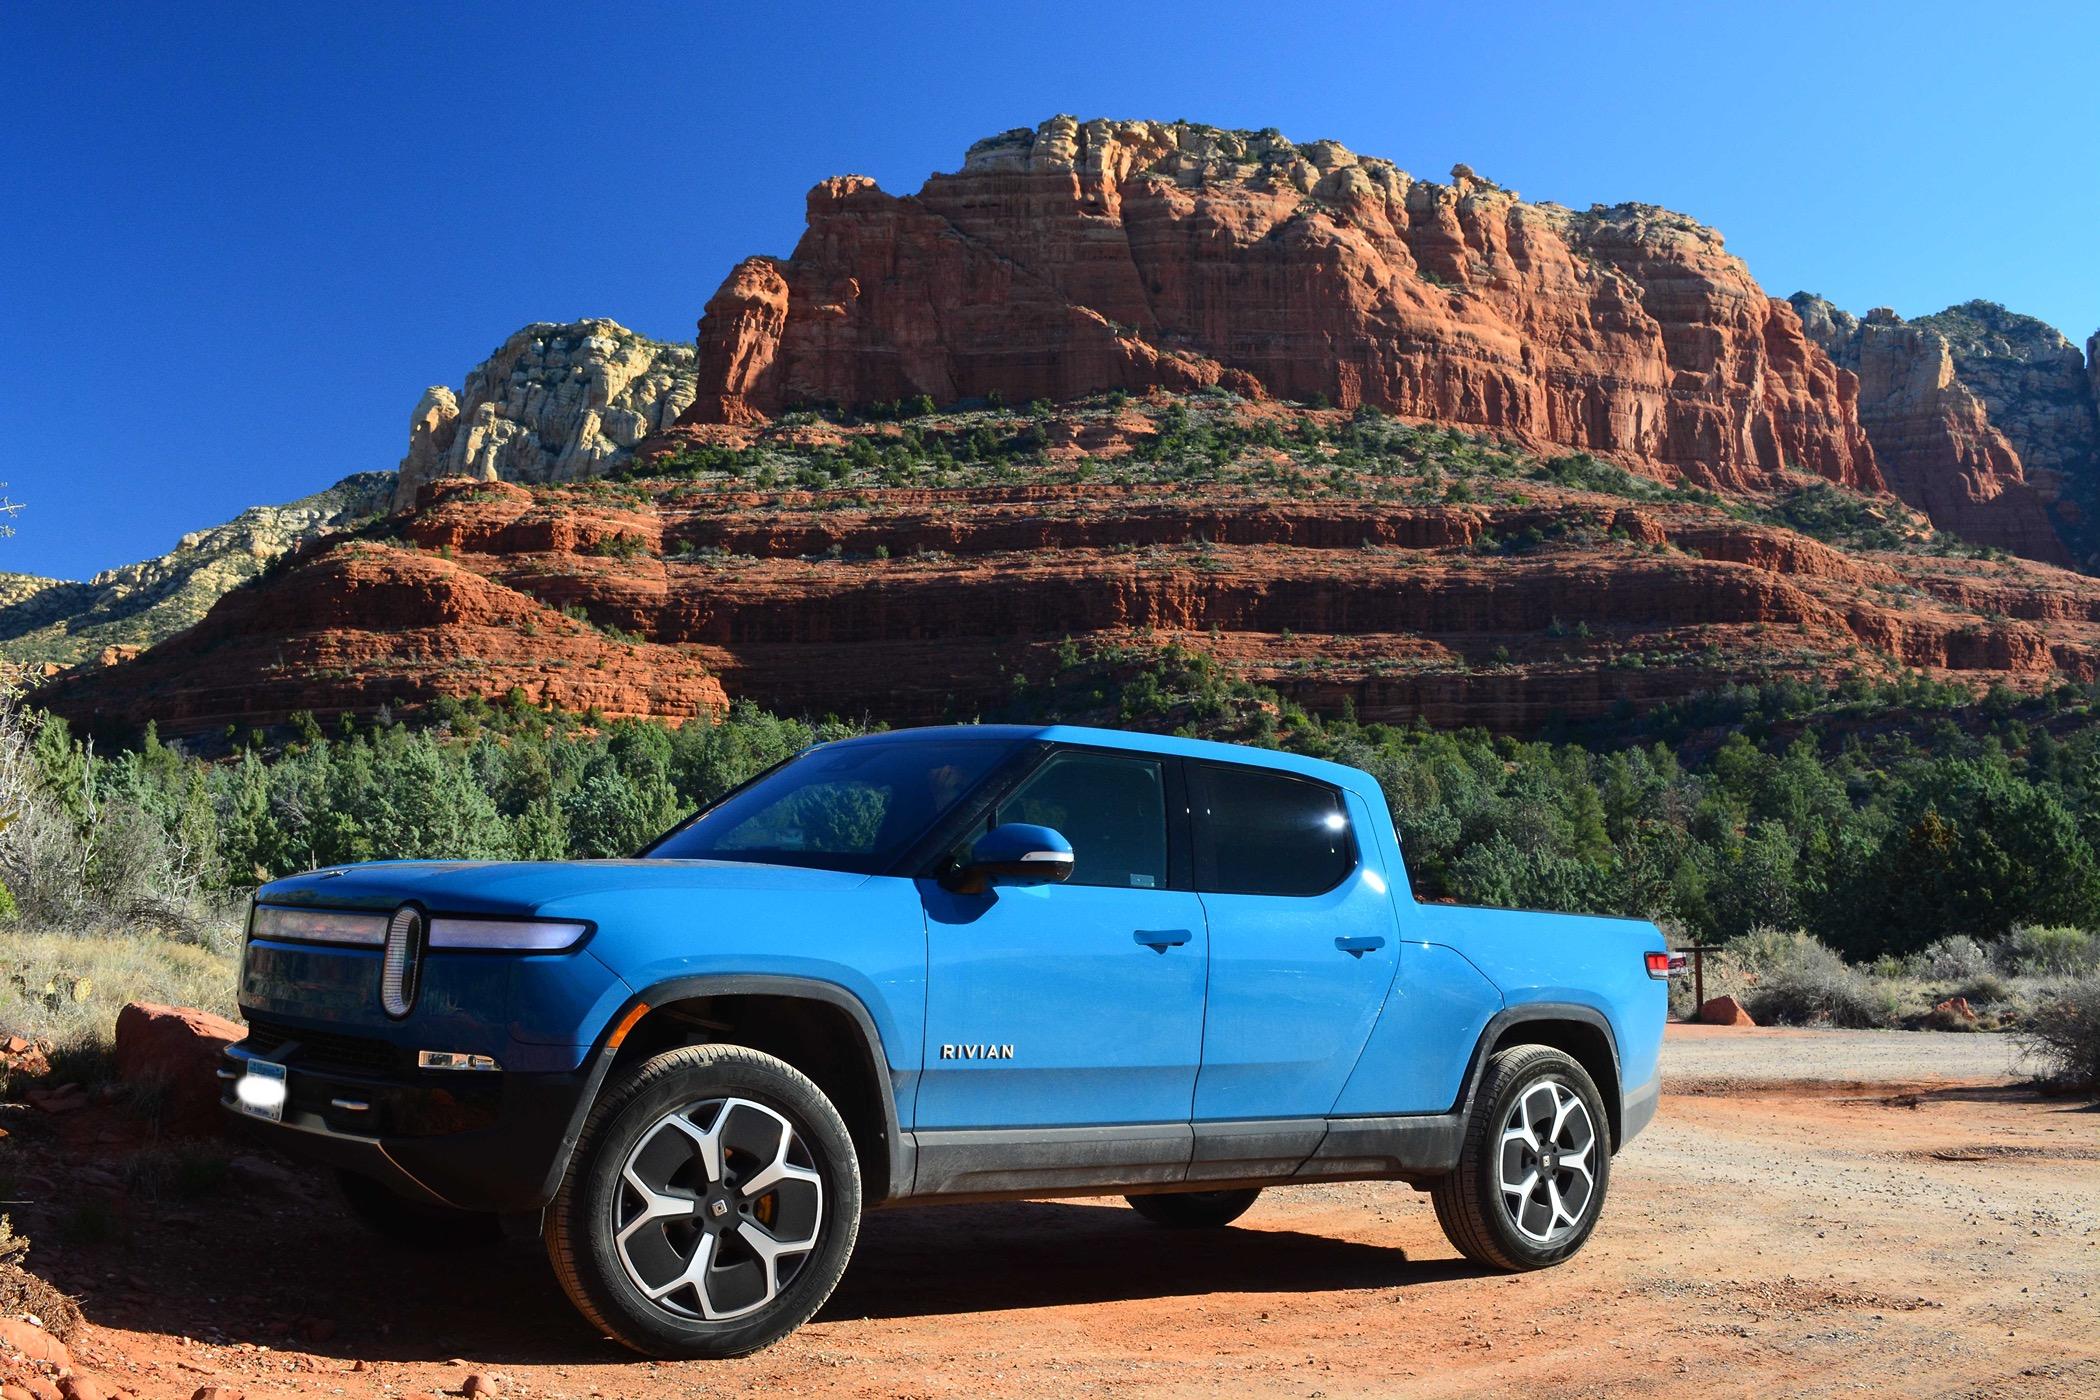
The Obligatory Rivian Eye Candy Photos;
Me, Luna and Vivian. Diana, who gets tons of credit for being the Rivian systems engineer, navigator and data collection officer as well as photographer is not pictured.....


Now, on to the data.
CHARGING DATA: As noted above, charging was very uneventful. Electrify America was reliable, fast and inexpensive.
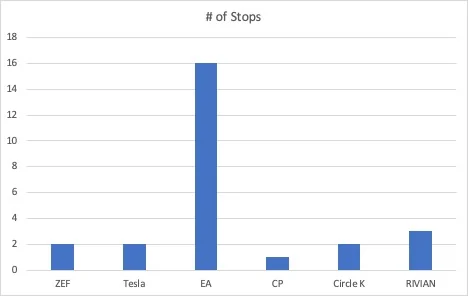
Chart 1). Number of stops at each network over the whole out and back trip (EA=Electrify America, CP=Charge Point).
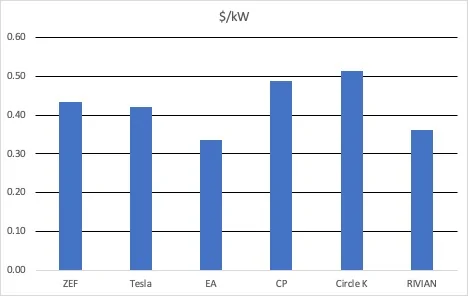
Chart 2). Average cost in kWh/$ (I used the EA membership discount)
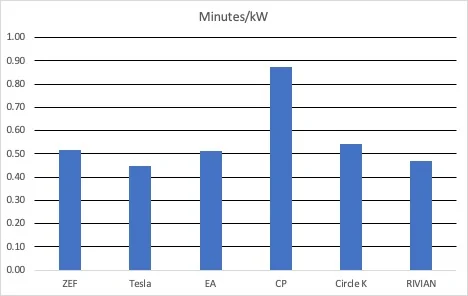
Chart 3). Average charging rate in kWh/min
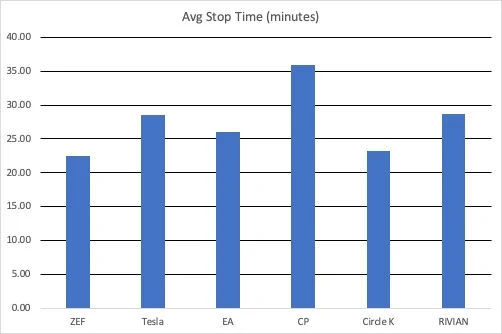
Chart 4). Average time charging at each network


Repeating this paragraph from above for clarity on the data collection:
We took a lot of efficiency data during the trip. Every 50 miles we reset the trip meter and recorded consumption, efficiency, air temperature, wind speed, starting and ending elevation, and average speed. We only did this while on the freeway traveling at 75 mph. Anytime we were in a metro area like Denver with slower speed limits we did not collect data. So we have 52 individual data points from these 52 50-mile segments. Very detailed graphs and correlations to temperature and elevation change below; From Minneapolis to Colorado Spring I was in Conserve Mode but in the mountainous area between Colorado Springs and Sedona I was in All Purpose.
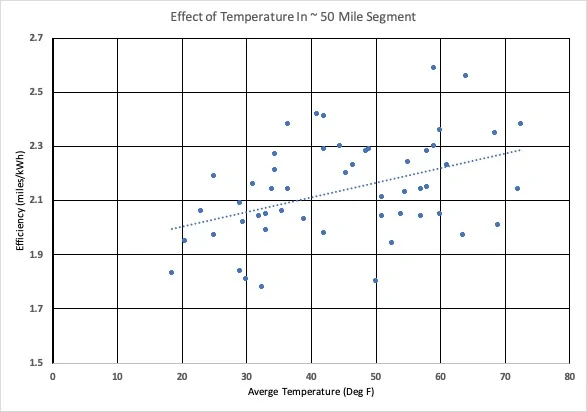
Correlation between temperature and Efficiency (wind was a major factor on this trip and clouds the temperature/elevation correlations)

We had temperatures between 15 and 73 degrees so a nice wide spread in temperature. The trend is as expected but the correlation is weak due to the effects of wind and elevation change. Overall our efficiency average around 2.2 miles/kWh at an average temperature of 45 degrees.
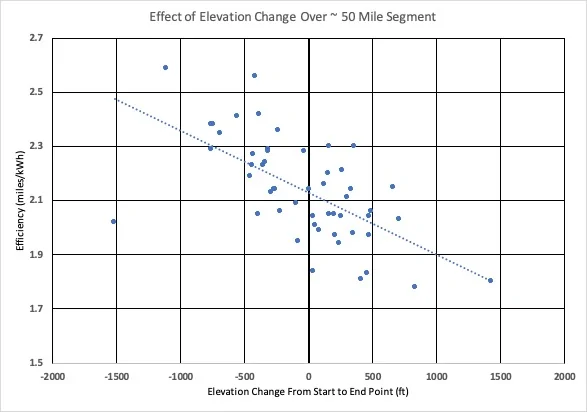
Correlation between Elevation Change over the 50 mile segment and Efficiency (wind was a major factor and clouds the data)
The correlation with elevation change is pretty strong. We started at around 800 feet in Minnesota and peaked at just under 8000 feet. Detailed elevation data in each segment can be found in the charts that follow.
Wind was a major factor and I made no attempt to graph it correlation it because it's pretty darn hard. But I'm pretty convinced cross winds are as impactful and headwinds on reducing efficiency. Even read quartering winds are more harmful than helpful. The effect of wind can be teased out in the following graphs.
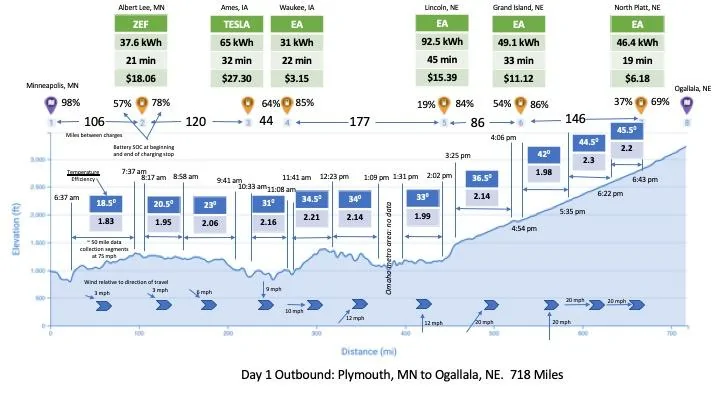
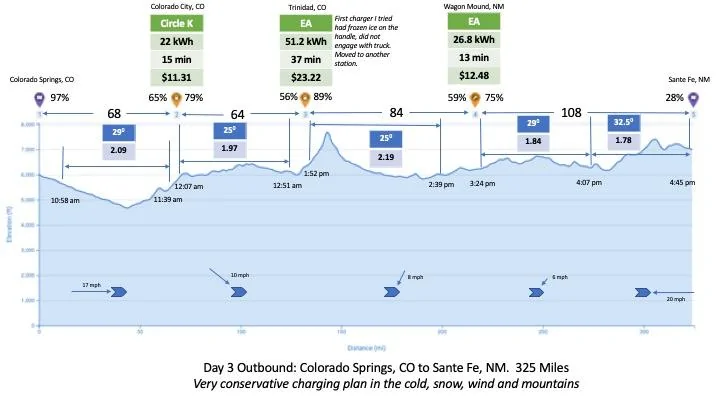
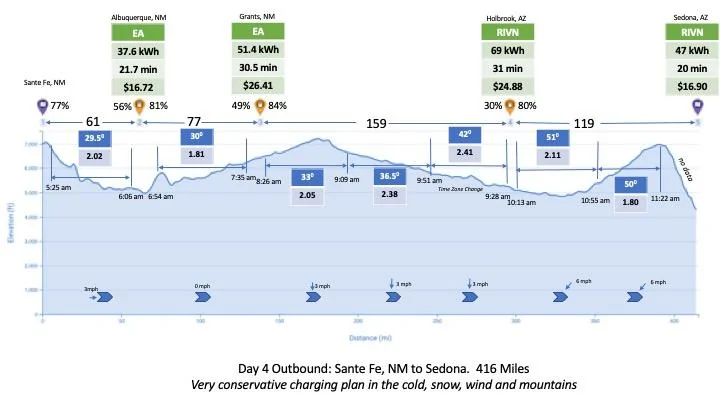
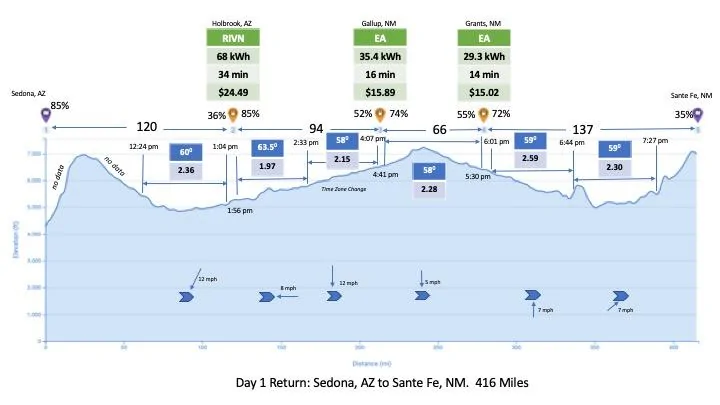
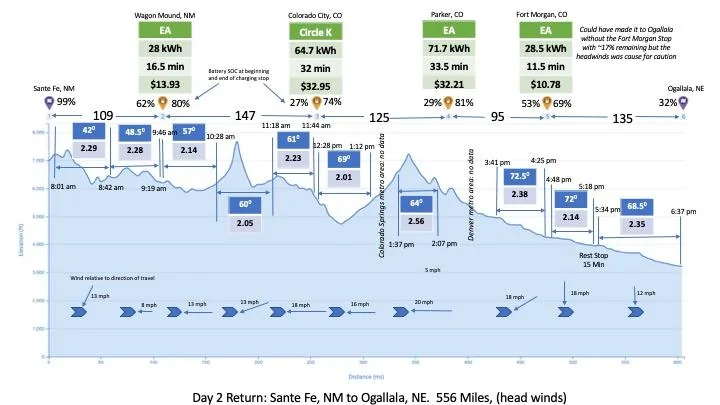
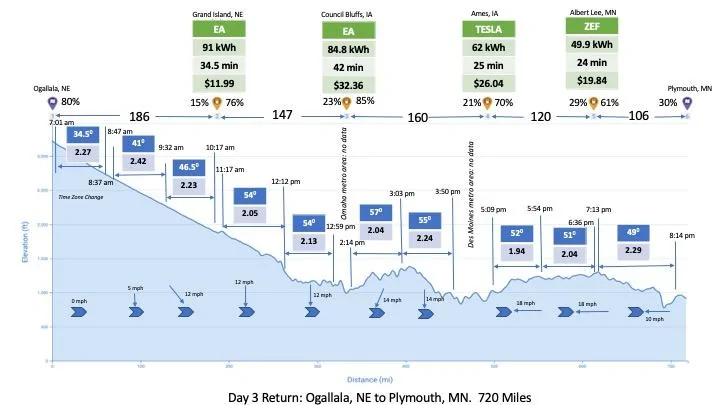
Ok, I'm kinda proud of these next graphs. They show pretty much everything. The main blue line and shaded area is the elevation vs trip distance from the PlugShare maps. In addition it shows; charging network used and key charging metrics, Distance between charging stops, battery state of charge at start and end of charging. Temperature and efficiency data in each 50 mile segment. Time and elevation at each segment. Wind speed relative to the direction of travel in each segment.
There is one graph for each driving day. This is day one, 718 miles from MN to western Nebraska. Temperature is in the dark blue box and efficiency in the light blue boxes.

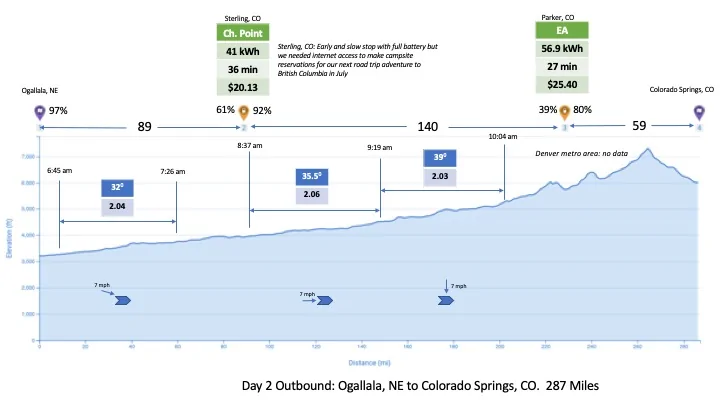
Day 2, short day to Colorado Springs to do some hiking.
Day 3, another short day to Sante Fe for another hiking stop. Followed a very conservative charging plan in the mountains with falling snow.
Day 4 from Sante Fe to Sedona, Played it conservative again with the sparse charging availability across New Mexico and Arizona.
Return trip data: With the warmer weather and some confidence on what the charging situation was like we did some longer stints on the way home.
Day 1: Sedona to Sante Fe
Day 2: Sante Fe to Ogallala NE.
Day 3: Ogallala NE to home
It was a great trip. Would not want to do it with any other vehicle I've owned. The R1T is quiet, powerful, comfortable and just a joy. Looking forward to the British Columbia trip which will be really easy charging wise with excellent Tesla charging stations along the way.
We drove our R1T Quad Motor with 21" road tires from Minneapolis to Sedona to do some hiking by way of Des Moines, Omaha, Denver, Sante Fe. Took 4 days on the way out with over night stops in western Nebraska, Colorado Springs, Sante Fe. The way out was kinda cold and snowy so followed a very conservative charging plan with short stints and keeping the battery pretty full. Spend 1 week in Sedona enjoying the hiking then did the return trip in 3 days with stops in Sante Fe and western Nebraska again.
Used mostly Electrify America with no issues except for an ice covered plug in Trinidad, CO that would not engage. Moved to another charger and it worked fine. Overall a very uneventful trip charging wise. As many have noted previously, a long road trip with an EV is actually enjoyable when you can take regular mental and physical breaks at the charging stops vs hammering with non-stop driving in an ICE. We enjoyed the trip and would absolutely to it again in the Rivian. In fact, we are planning an even longer trip to British Columbia this summer.
We took a lot of efficiency data during the trip. Every 50 miles we reset the trip meter and recorded consumption, efficiency, air temperature, wind speed, starting and ending elevation, and average speed. We only did this while on the freeway traveling at 75 mph. Anytime we were in a metro area like Denver with slower speed limits we did not collect data. So we have 52 individual data points from these 52 50-mile segments. Very detailed graphs and correlations to temperature and elevation change below; From Minneapolis to Colorado Springs I was in Conserve Mode but in the mountainous area between Colorado Springs and Sedona I was in All Purpose. But before we get to the data and graphs.......
The Obligatory Rivian Eye Candy Photos;
Me, Luna and Vivian. Diana, who gets tons of credit for being the Rivian systems engineer, navigator and data collection officer as well as photographer is not pictured.....
Now, on to the data.
CHARGING DATA: As noted above, charging was very uneventful. Electrify America was reliable, fast and inexpensive.
Chart 1). Number of stops at each network over the whole out and back trip (EA=Electrify America, CP=Charge Point).
Chart 2). Average cost in kWh/$ (I used the EA membership discount)
Chart 3). Average charging rate in kWh/min
Chart 4). Average time charging at each network
Repeating this paragraph from above for clarity on the data collection:
We took a lot of efficiency data during the trip. Every 50 miles we reset the trip meter and recorded consumption, efficiency, air temperature, wind speed, starting and ending elevation, and average speed. We only did this while on the freeway traveling at 75 mph. Anytime we were in a metro area like Denver with slower speed limits we did not collect data. So we have 52 individual data points from these 52 50-mile segments. Very detailed graphs and correlations to temperature and elevation change below; From Minneapolis to Colorado Spring I was in Conserve Mode but in the mountainous area between Colorado Springs and Sedona I was in All Purpose.
Correlation between temperature and Efficiency (wind was a major factor on this trip and clouds the temperature/elevation correlations)
We had temperatures between 15 and 73 degrees so a nice wide spread in temperature. The trend is as expected but the correlation is weak due to the effects of wind and elevation change. Overall our efficiency average around 2.2 miles/kWh at an average temperature of 45 degrees.
Correlation between Elevation Change over the 50 mile segment and Efficiency (wind was a major factor and clouds the data)
The correlation with elevation change is pretty strong. We started at around 800 feet in Minnesota and peaked at just under 8000 feet. Detailed elevation data in each segment can be found in the charts that follow.
Wind was a major factor and I made no attempt to graph it correlation it because it's pretty darn hard. But I'm pretty convinced cross winds are as impactful and headwinds on reducing efficiency. Even read quartering winds are more harmful than helpful. The effect of wind can be teased out in the following graphs.
Ok, I'm kinda proud of these next graphs. They show pretty much everything. The main blue line and shaded area is the elevation vs trip distance from the PlugShare maps. In addition it shows; charging network used and key charging metrics, Distance between charging stops, battery state of charge at start and end of charging. Temperature and efficiency data in each 50 mile segment. Time and elevation at each segment. Wind speed relative to the direction of travel in each segment.
There is one graph for each driving day. This is day one, 718 miles from MN to western Nebraska. Temperature is in the dark blue box and efficiency in the light blue boxes.
Day 2, short day to Colorado Springs to do some hiking.
Day 3, another short day to Sante Fe for another hiking stop. Followed a very conservative charging plan in the mountains with falling snow.
Day 4 from Sante Fe to Sedona, Played it conservative again with the sparse charging availability across New Mexico and Arizona.
Return trip data: With the warmer weather and some confidence on what the charging situation was like we did some longer stints on the way home.
Day 1: Sedona to Sante Fe
Day 2: Sante Fe to Ogallala NE.
Day 3: Ogallala NE to home
It was a great trip. Would not want to do it with any other vehicle I've owned. The R1T is quiet, powerful, comfortable and just a joy. Looking forward to the British Columbia trip which will be really easy charging wise with excellent Tesla charging stations along the way.
Sponsored
