Jiji
Well-Known Member
- First Name
- Rick
- Joined
- Jun 21, 2023
- Threads
- 17
- Messages
- 296
- Reaction score
- 430
- Location
- Finger Lakes, NY
- Website
- github.com
- Vehicles
- Rivian Blue R1S
- Thread starter
- #1
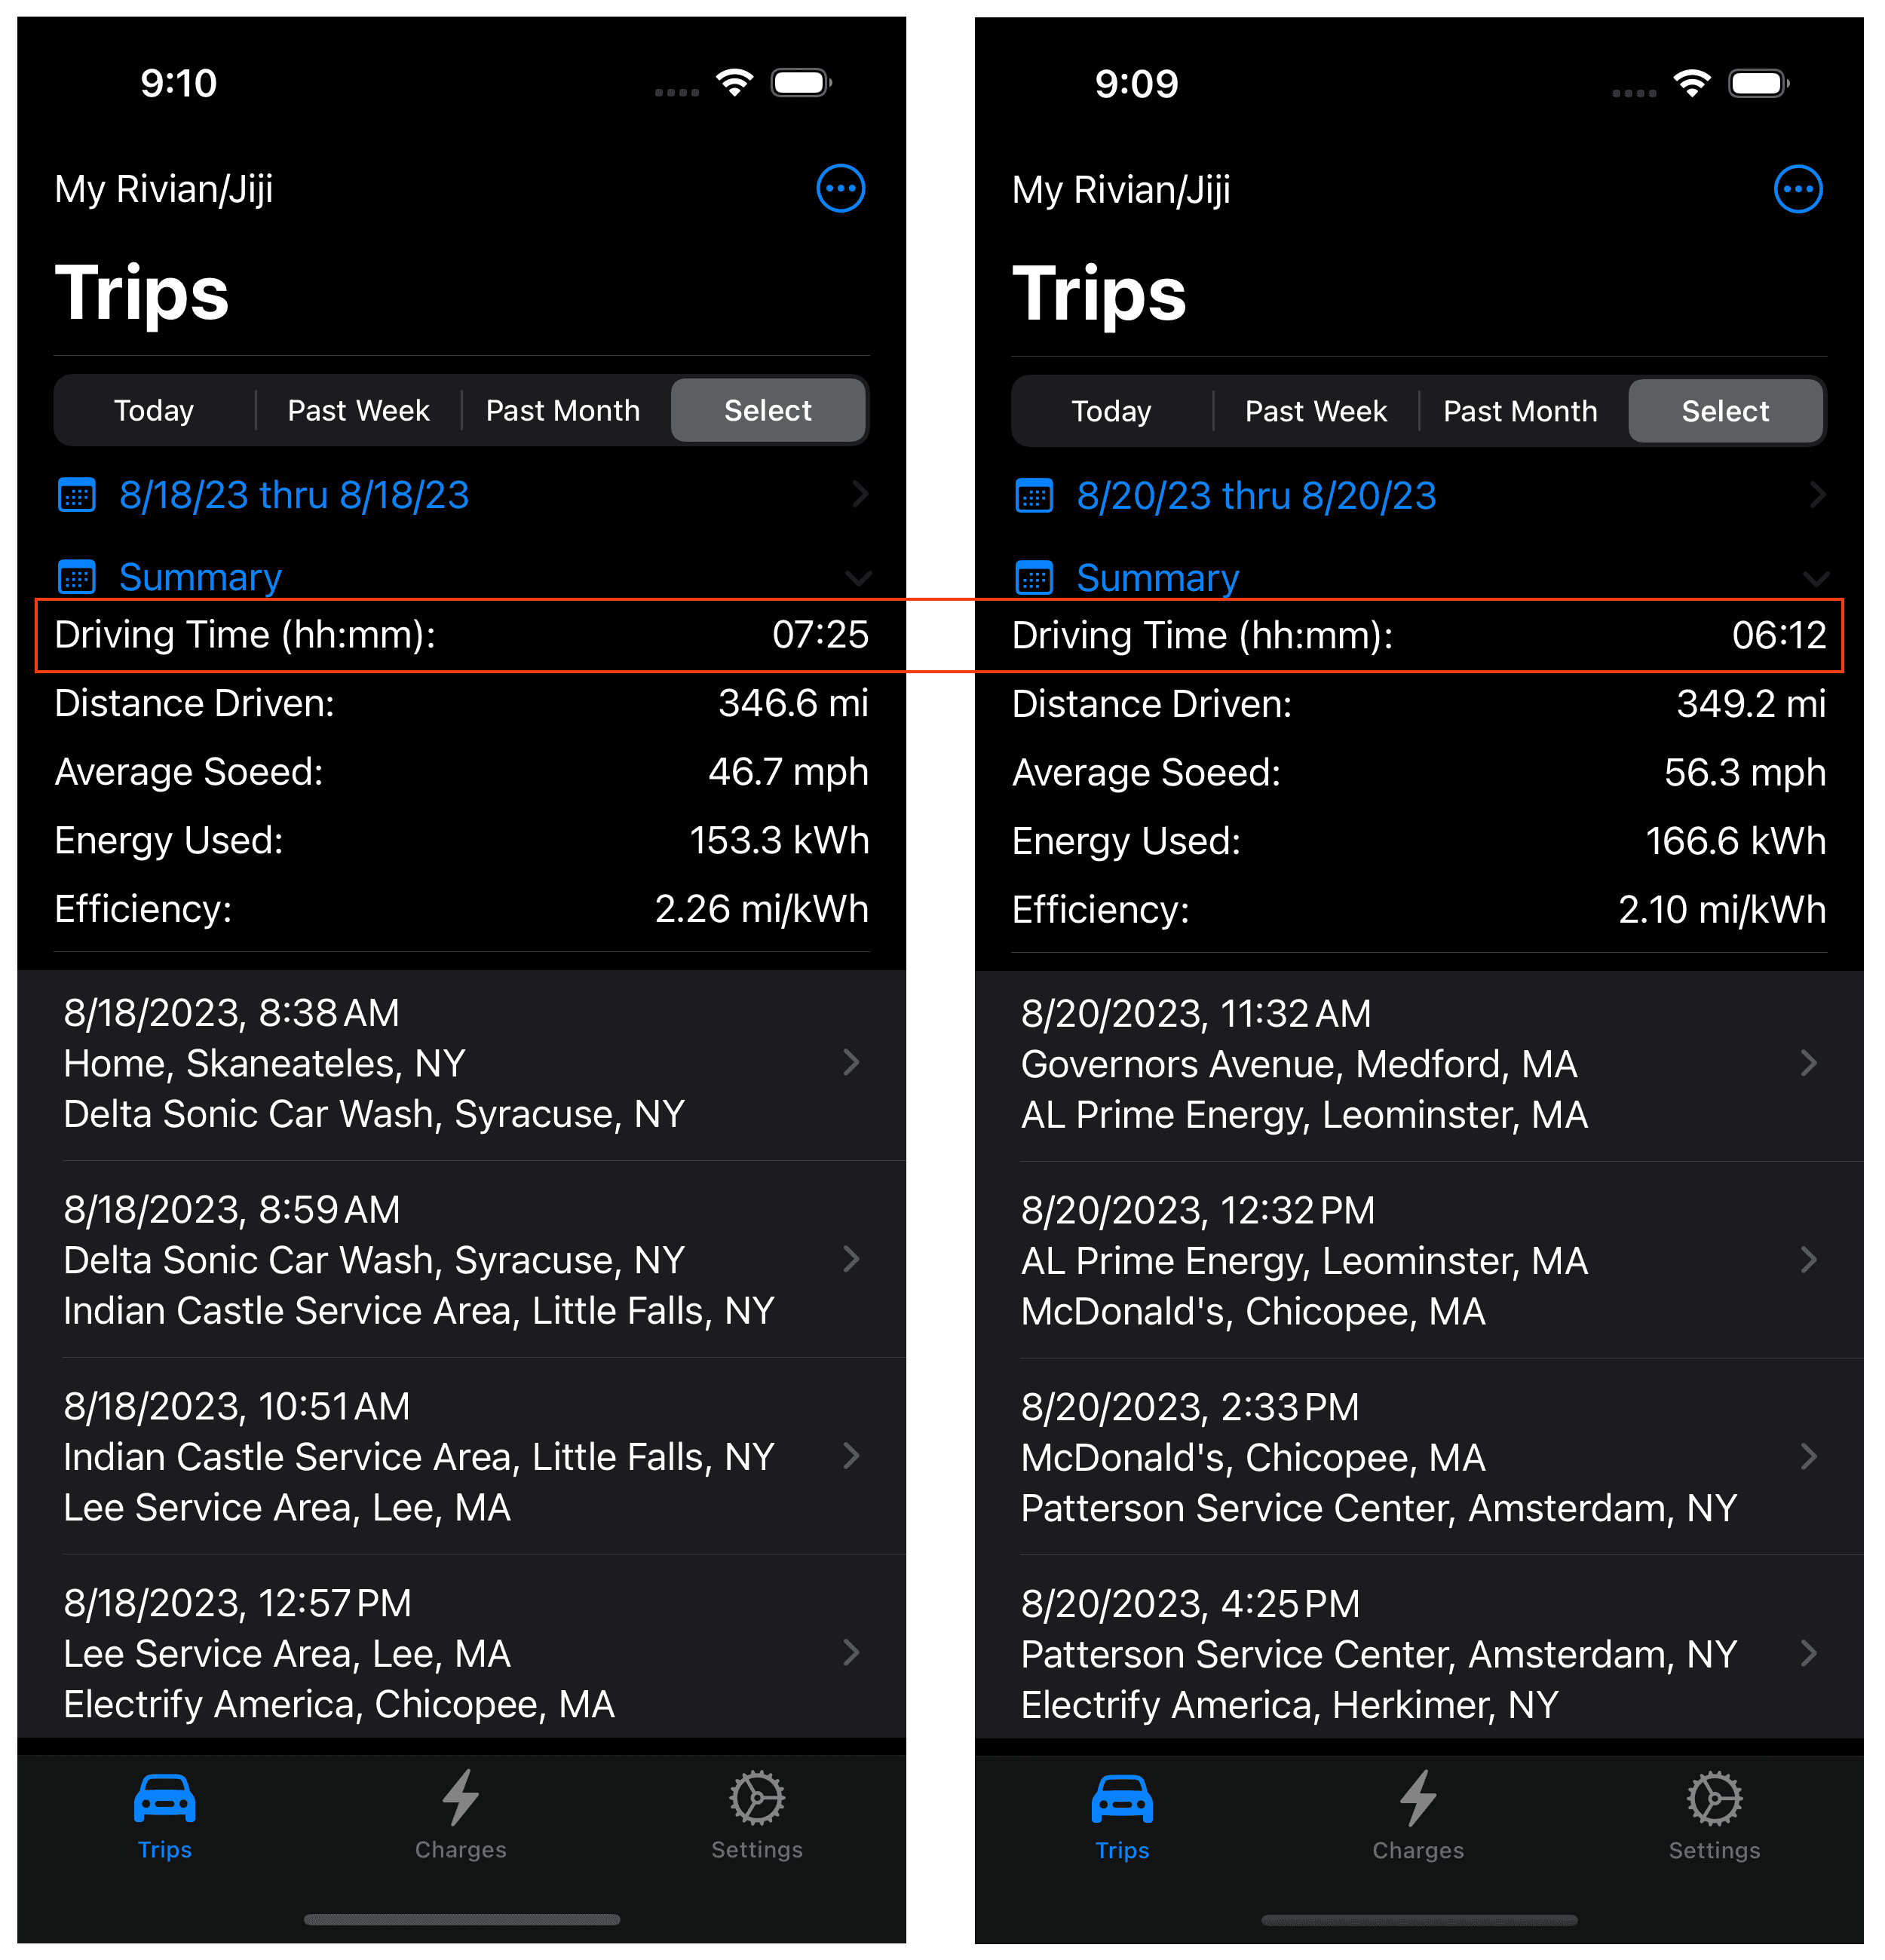
This past weekend I drove to Boston from Central NY and got to collect some data for my Rivian road-tripping, fast charging app. Here is a summary of the outbound and return legs as recorded by my iOS app:

For some reason traffic was especially heavy in the Bay State and when the construction zones were present it really bogged down. On the return trip I avoided the Mass Pike in the Boston area and saved over an hour travel time and the much higher average speed is reflected in the energy consumed returning to NY.
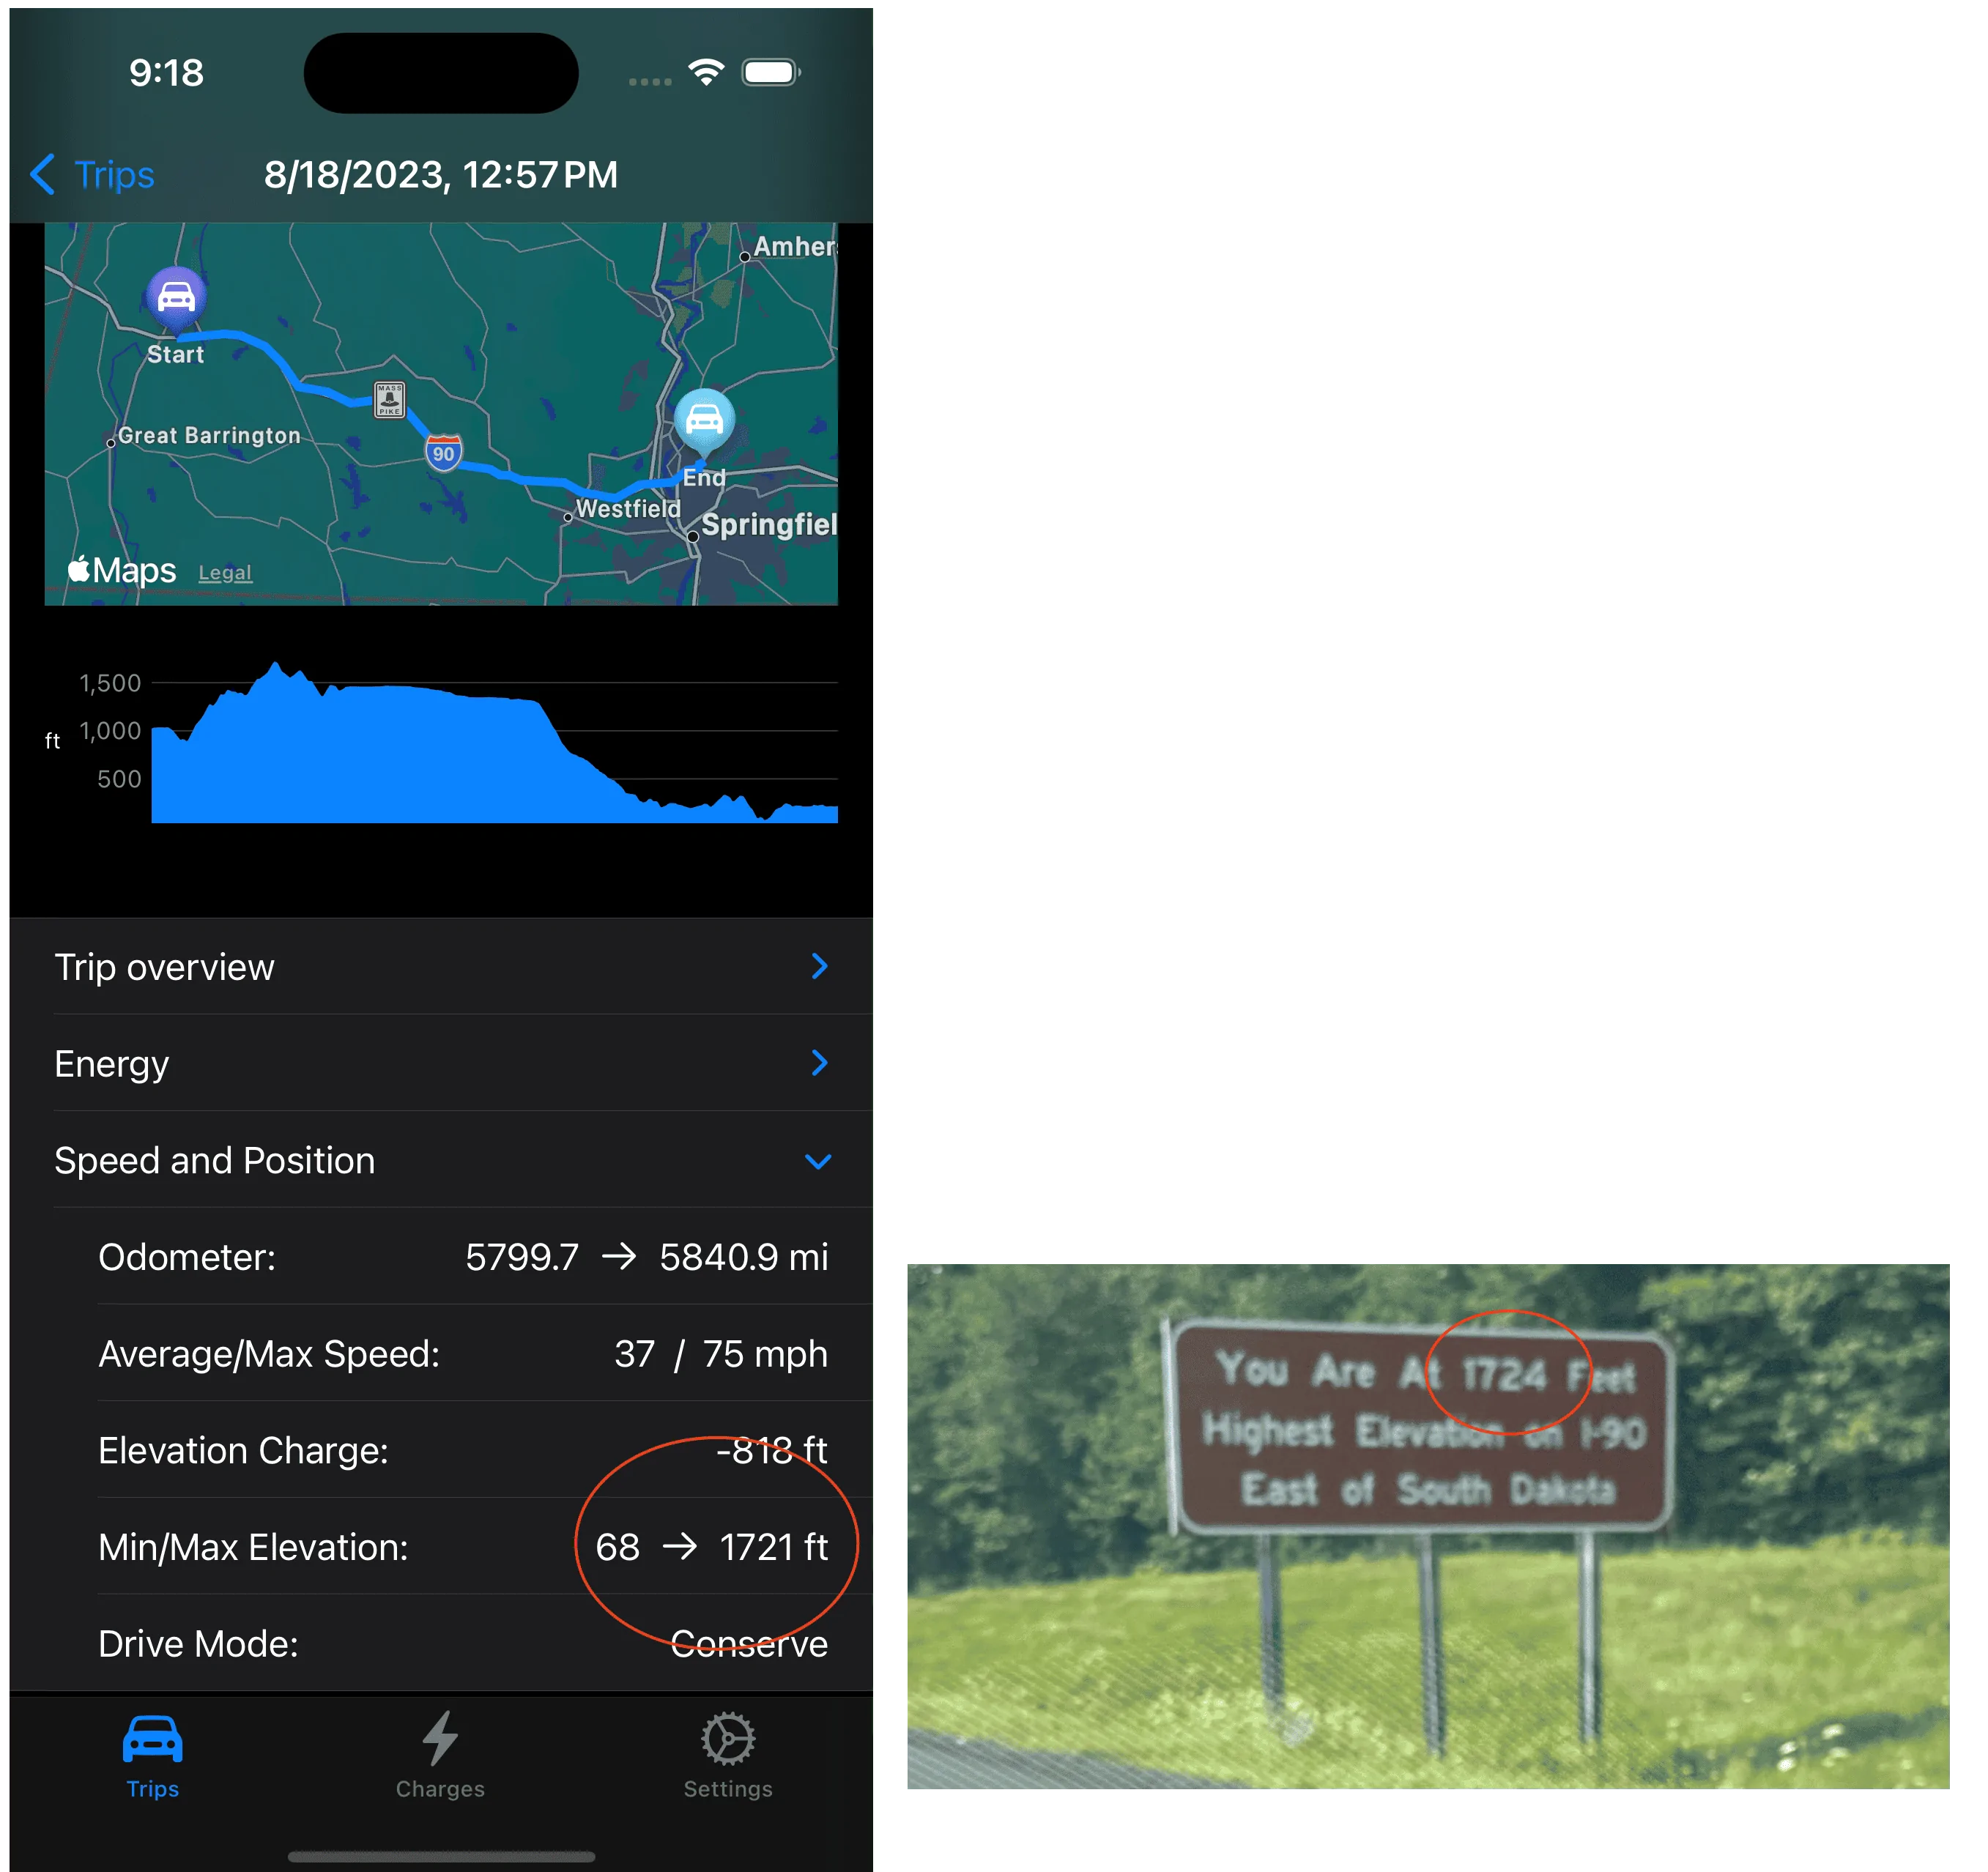
Here is a detailed view of the trip from the Lee Service Area to Electrify America in Chicopee, this leg includes the highest elevation on the trip (1724') and I wanted to capture it for software testing purposes, looks like I do OK using the iPhone for the GPS data with just a meter discrepancy:

Oops, that is embarrassing but I just fixed that typo while proofreading the post. You see I record the drive mode and wish I could log the tire pressures but the Rivian API only reports "OK" and not an actual tire pressure.
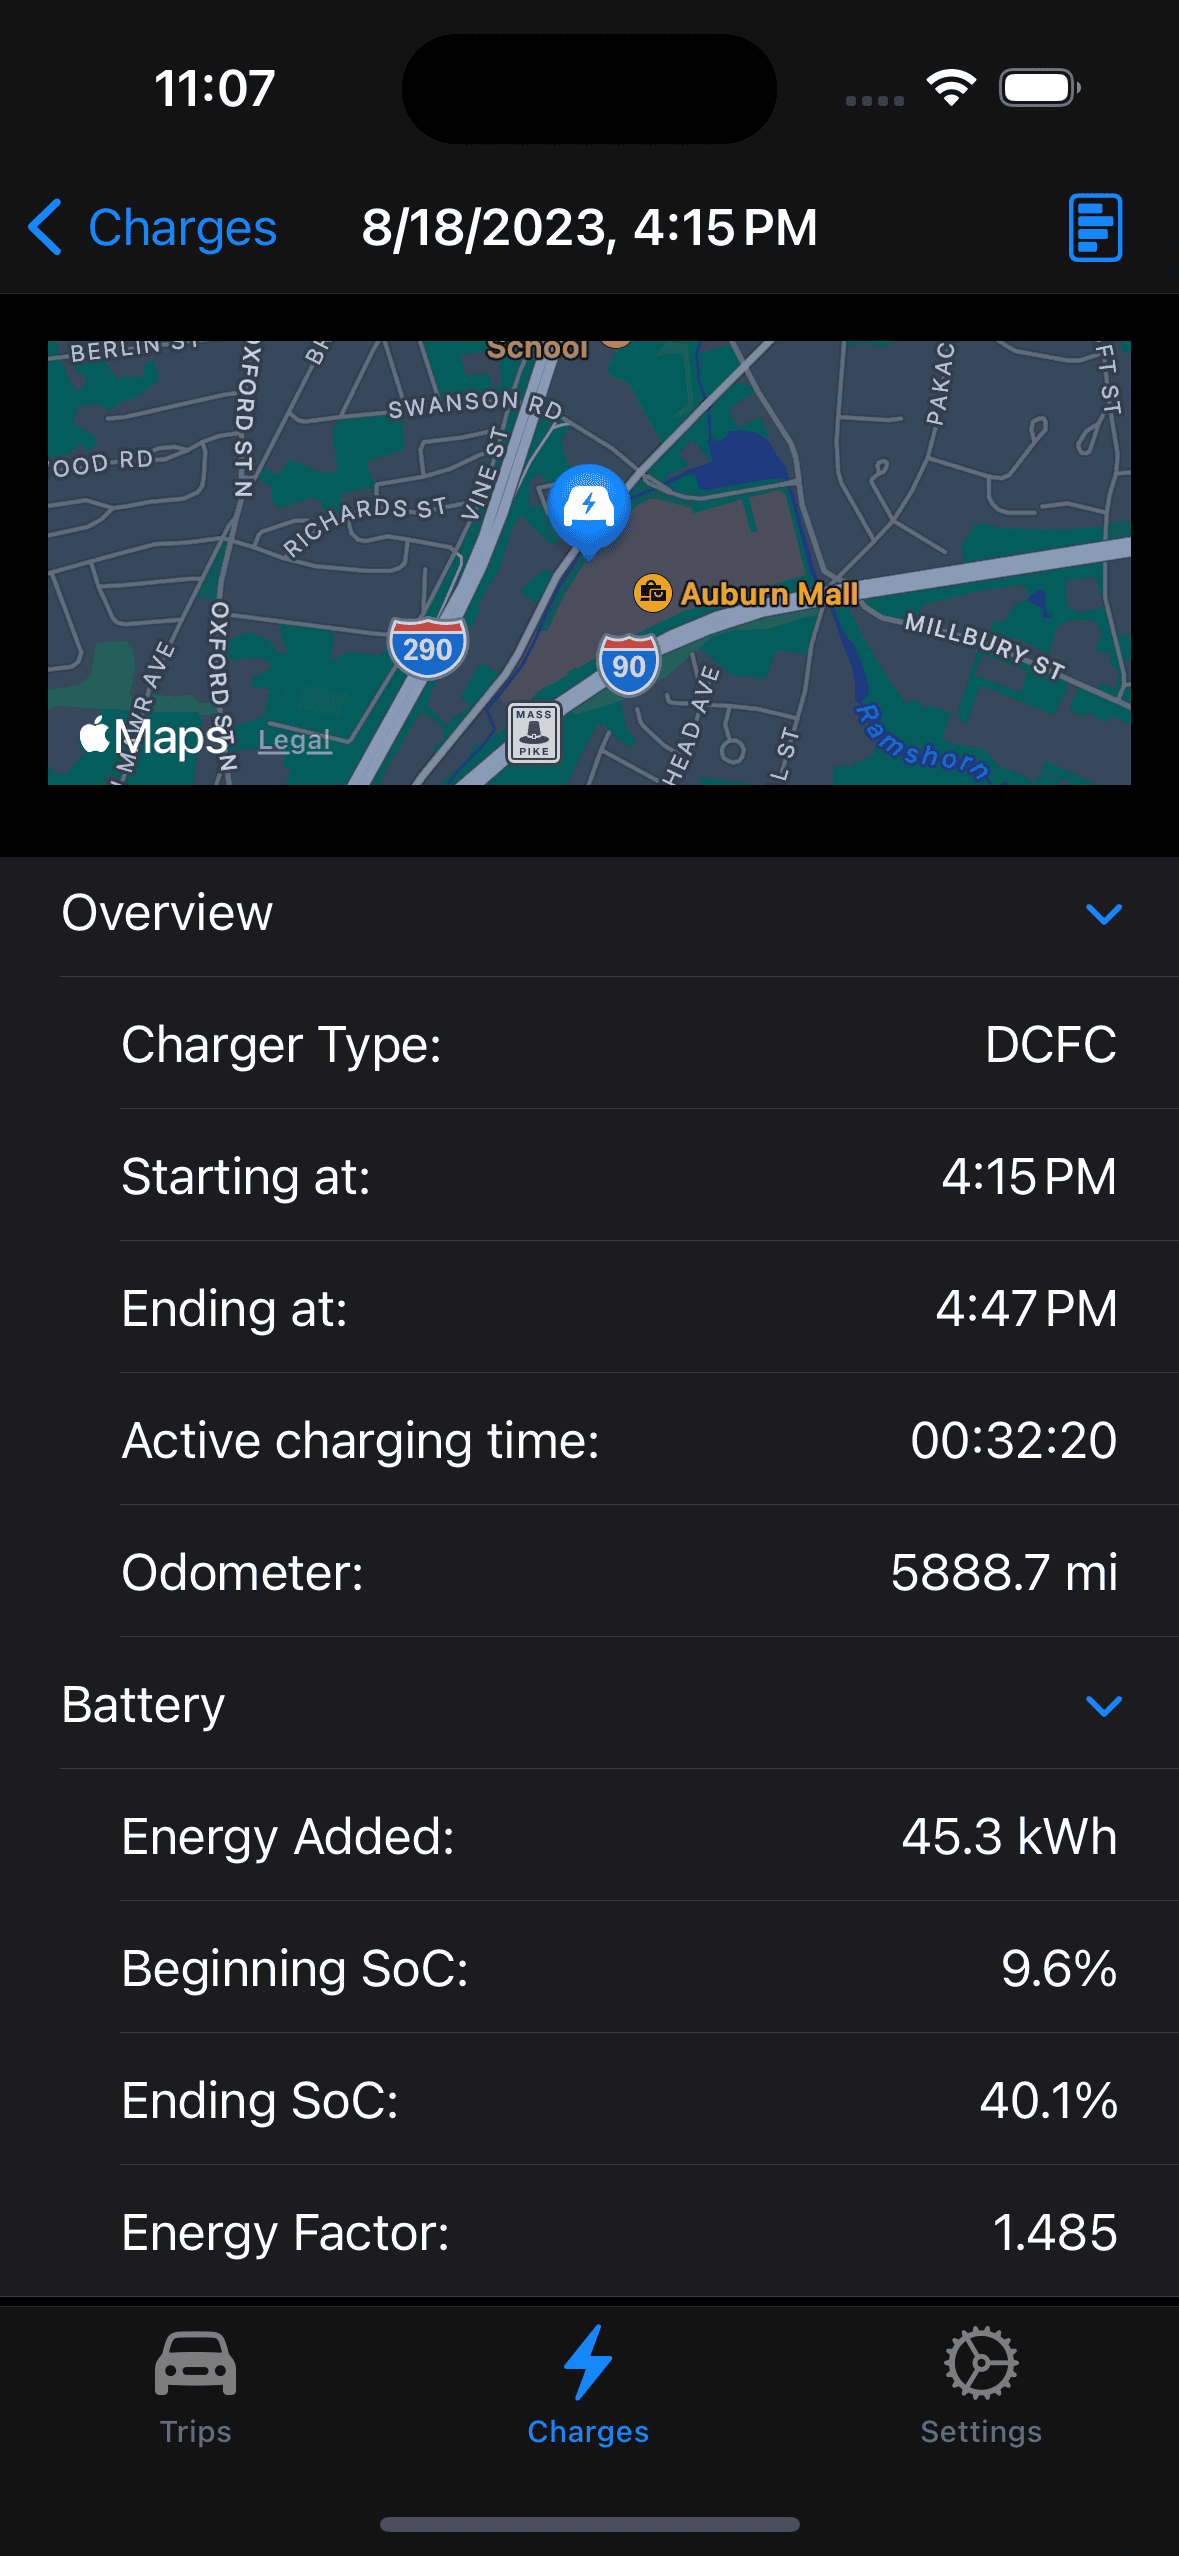
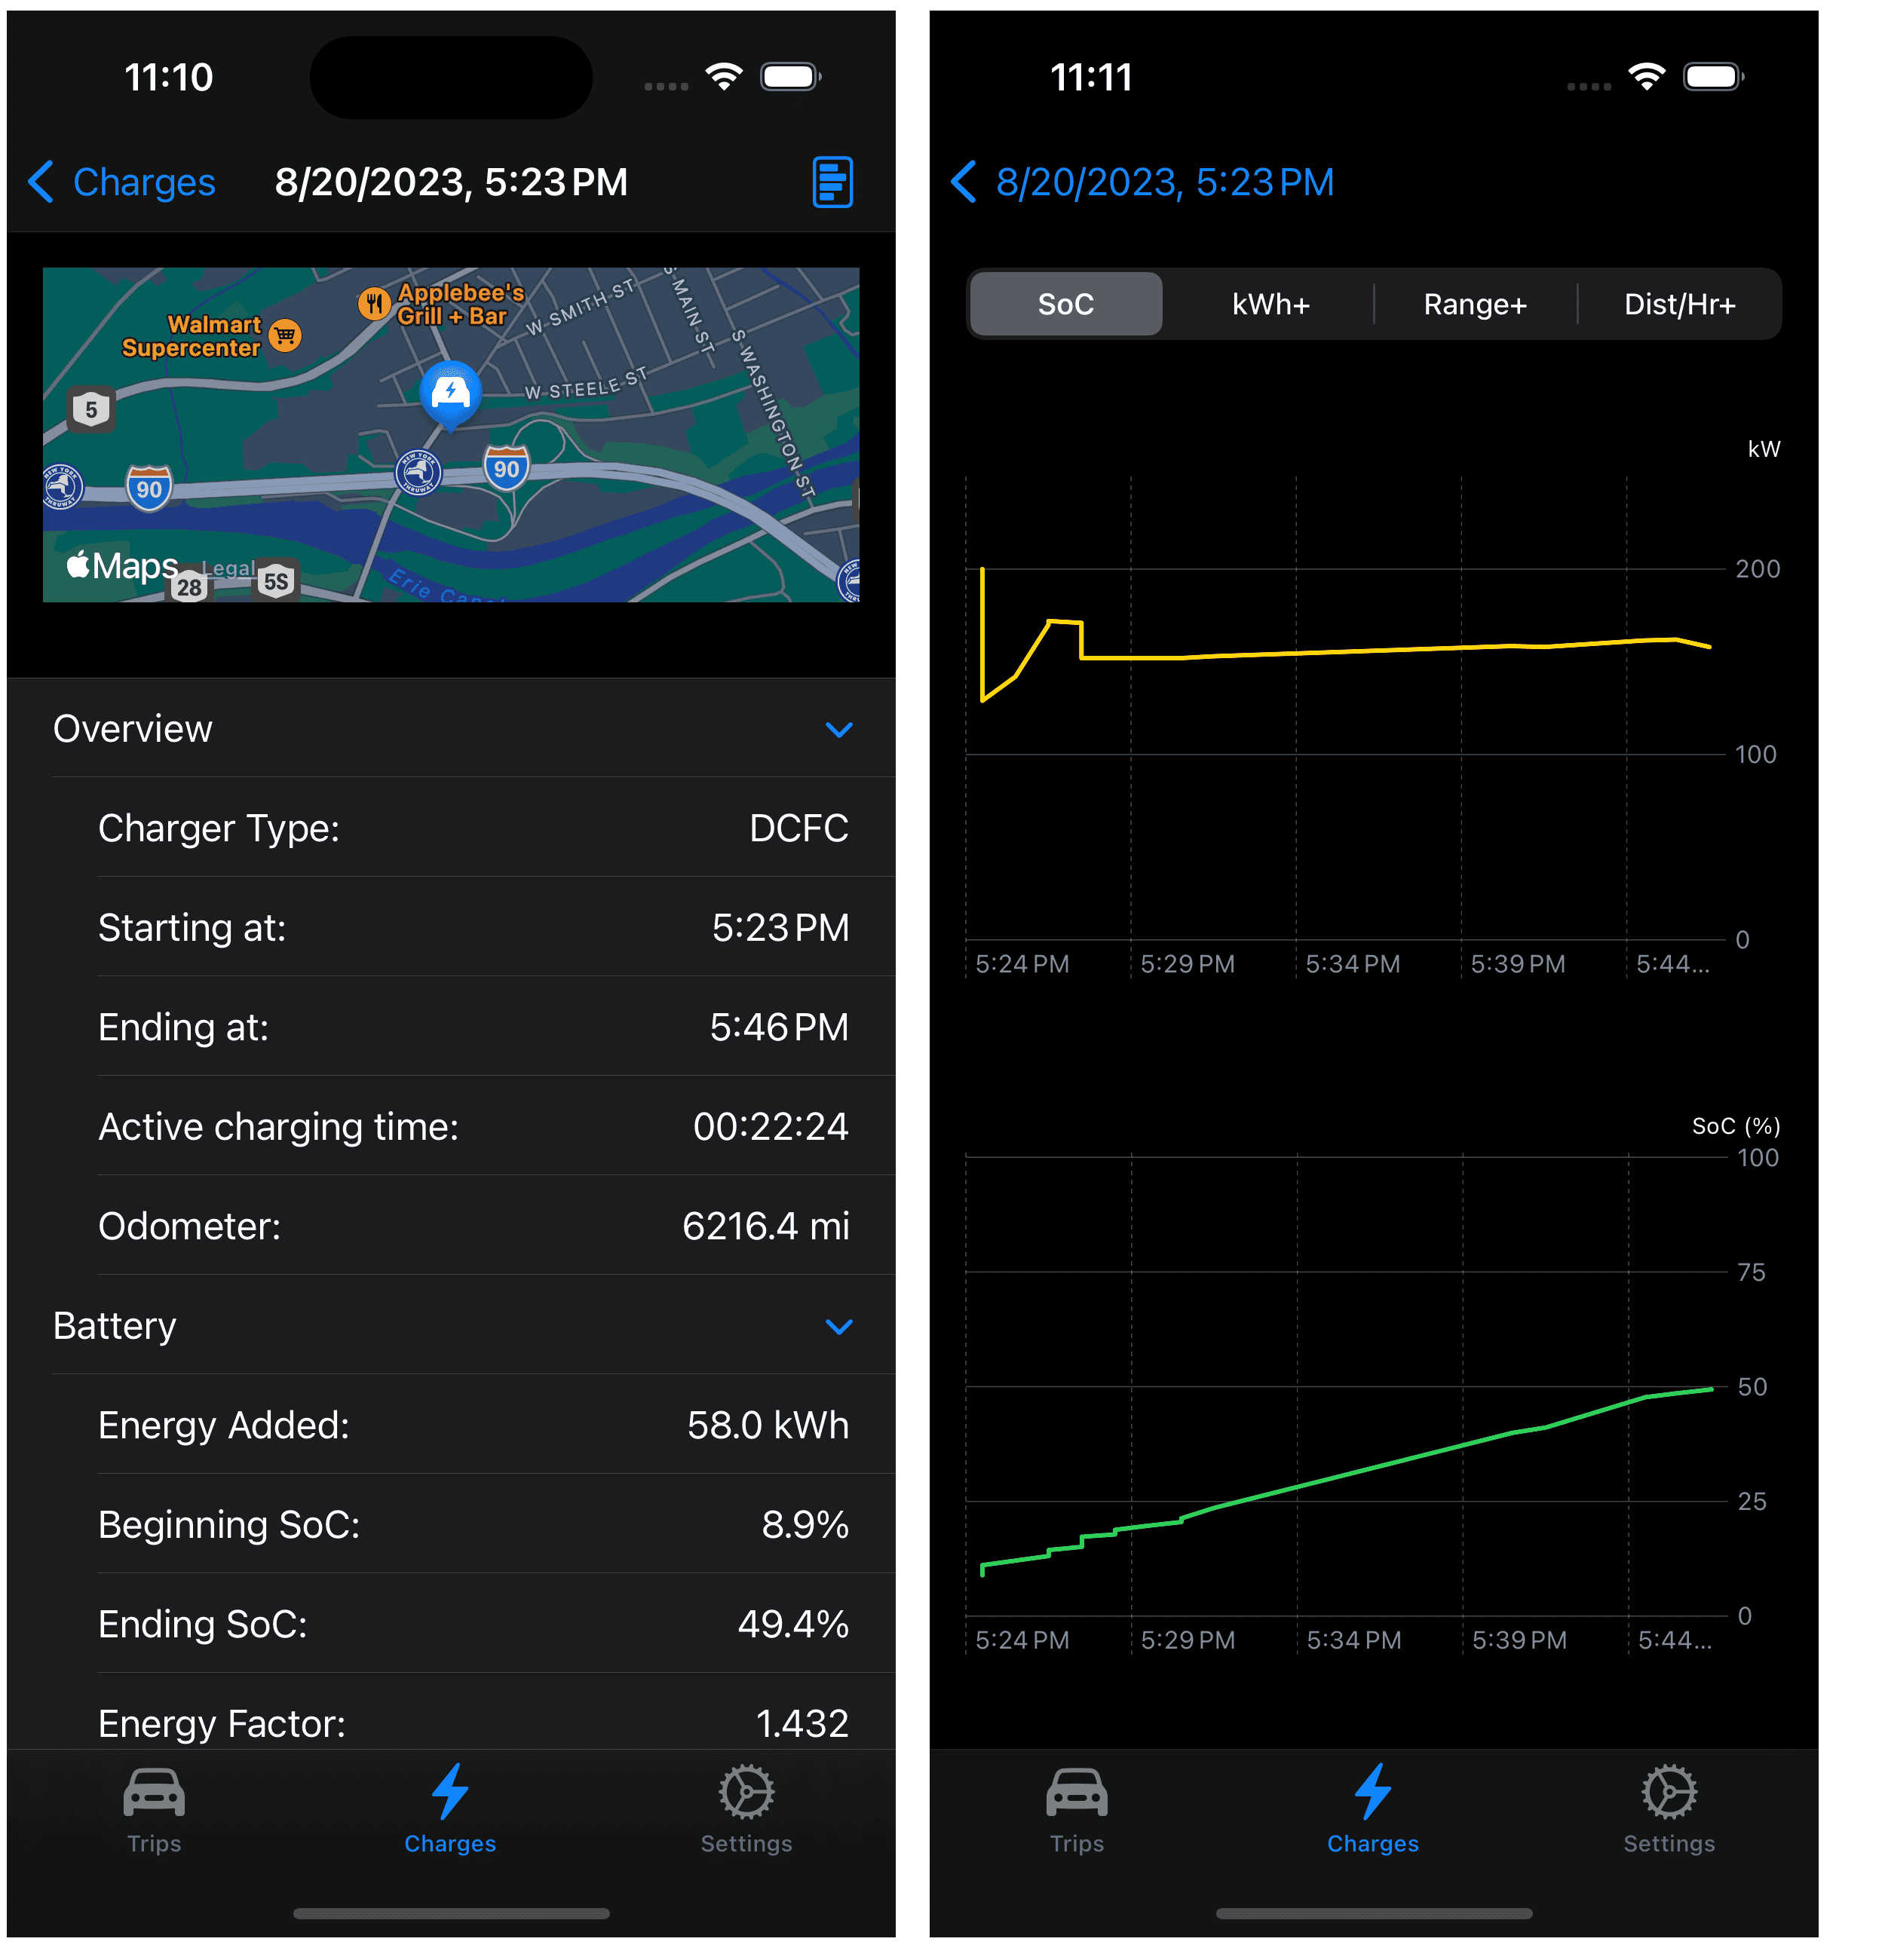
Of course it is nice to also keep track of the charging sessions during the weekend, luckily I had access to an L2 charger at the destination so just one stop each way to DCFC charge. As you can see in the charging curve on the right, EA didn't do me any favors even with arriving with less than 10% SoC but these were 150kW max and I only needed to add a few miles to get to our Boston destination:

I'll hope you can figure out the summary and I'll explain the Energy Factor. This is the number of kWh per unit change in the State of Charge (SoC) and is how I estimate the efficiency. The Rivian API does not share the energy used but a charge session does and I can read the beginning and ending SoC and is "good enough". So on this weekend road trip, the Energy Factor was 1.429 kWh per SoC percentage, this would reflect 14.29 kWh for a 10% change in the SoC.
While not perfect is does include all energy replaced and includes any losses in the process (charging inefficiencies, preconditioing, etc) so I am happy with it until I can come up with a better estimate. I have tried using trip odometer and while the values for a single trip might be valid over the course of a few days the reported total energy used and efficiency diverge so who knows what is being included plus I don't have the time or desire to manually log the trip odometer every time I get in my Rivian.
So there you have it, 700+ miles over three days with lots of data to satisfy my need to see what the Rivian is up to.
For some reason traffic was especially heavy in the Bay State and when the construction zones were present it really bogged down. On the return trip I avoided the Mass Pike in the Boston area and saved over an hour travel time and the much higher average speed is reflected in the energy consumed returning to NY.
Here is a detailed view of the trip from the Lee Service Area to Electrify America in Chicopee, this leg includes the highest elevation on the trip (1724') and I wanted to capture it for software testing purposes, looks like I do OK using the iPhone for the GPS data with just a meter discrepancy:
Oops, that is embarrassing but I just fixed that typo while proofreading the post. You see I record the drive mode and wish I could log the tire pressures but the Rivian API only reports "OK" and not an actual tire pressure.
Of course it is nice to also keep track of the charging sessions during the weekend, luckily I had access to an L2 charger at the destination so just one stop each way to DCFC charge. As you can see in the charging curve on the right, EA didn't do me any favors even with arriving with less than 10% SoC but these were 150kW max and I only needed to add a few miles to get to our Boston destination:
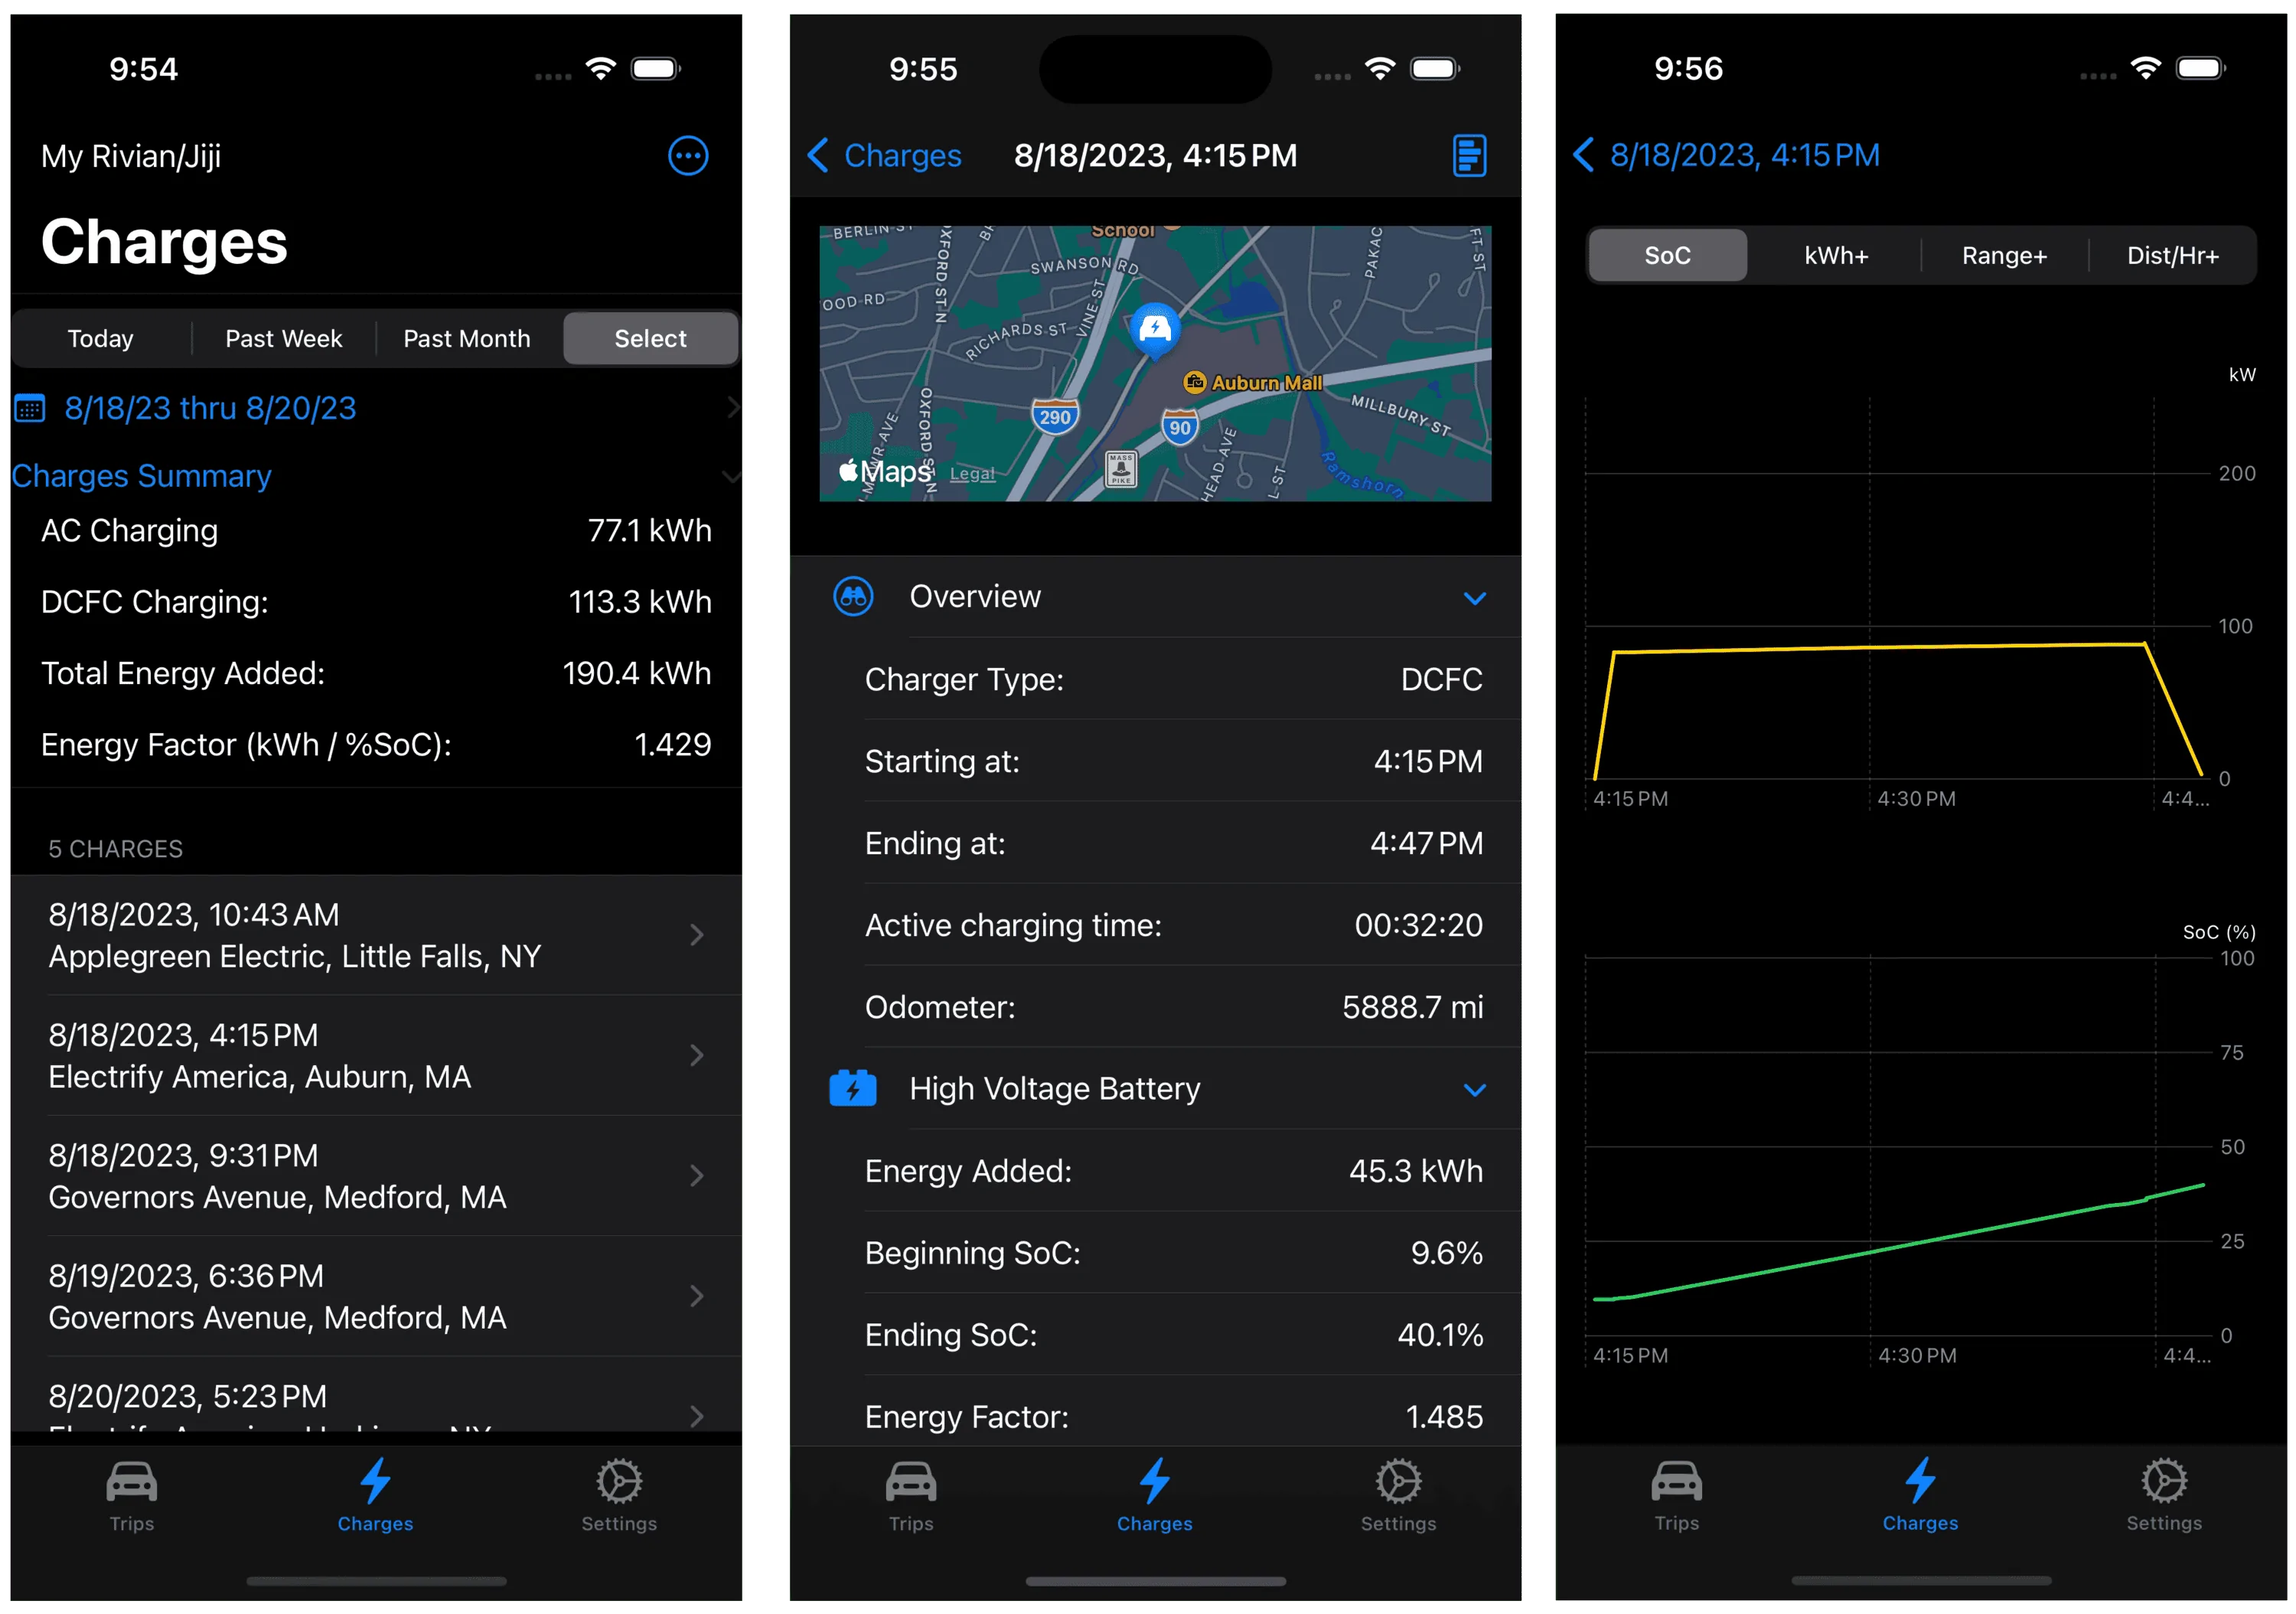
I'll hope you can figure out the summary and I'll explain the Energy Factor. This is the number of kWh per unit change in the State of Charge (SoC) and is how I estimate the efficiency. The Rivian API does not share the energy used but a charge session does and I can read the beginning and ending SoC and is "good enough". So on this weekend road trip, the Energy Factor was 1.429 kWh per SoC percentage, this would reflect 14.29 kWh for a 10% change in the SoC.
While not perfect is does include all energy replaced and includes any losses in the process (charging inefficiencies, preconditioing, etc) so I am happy with it until I can come up with a better estimate. I have tried using trip odometer and while the values for a single trip might be valid over the course of a few days the reported total energy used and efficiency diverge so who knows what is being included plus I don't have the time or desire to manually log the trip odometer every time I get in my Rivian.
So there you have it, 700+ miles over three days with lots of data to satisfy my need to see what the Rivian is up to.
Sponsored