
Electric Rivilution
Well-Known Member
- First Name
- Bill
- Joined
- Mar 5, 2019
- Threads
- 332
- Messages
- 515
- Reaction score
- 2,545
- Location
- Scottsdale
- Vehicles
- 2016 Model X / 2022 R1T
- Thread starter
- #1
Results:
Test Overview & Methodology [00:22]
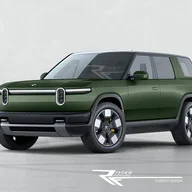
- Standard Test Protocol: Both vehicles were charged to 100%, set to recommended cold tire pressures (42 psi), put in their most efficient driving modes (Conserve Mode for R2; Chill Mode for Model Y), and driven at a constant 70-mph GPS speed along a flat, tree-lined highway (US-64) until they could no longer maintain 70 mph [00:29], [12:04], [18:28].
- Distance Accuracy: Because both vehicles’ odometers were slightly optimistic, the team calibrated the final mileage figures using a ground-truth reference vehicle (Porsche Cayenne) [01:02:20].
Detailed Behavior & Key Findings
1. Rivian R2 Performance
- Performance Curve: Maintained speed normally down to 5% battery, at which point power output began derating slightly [41:58].
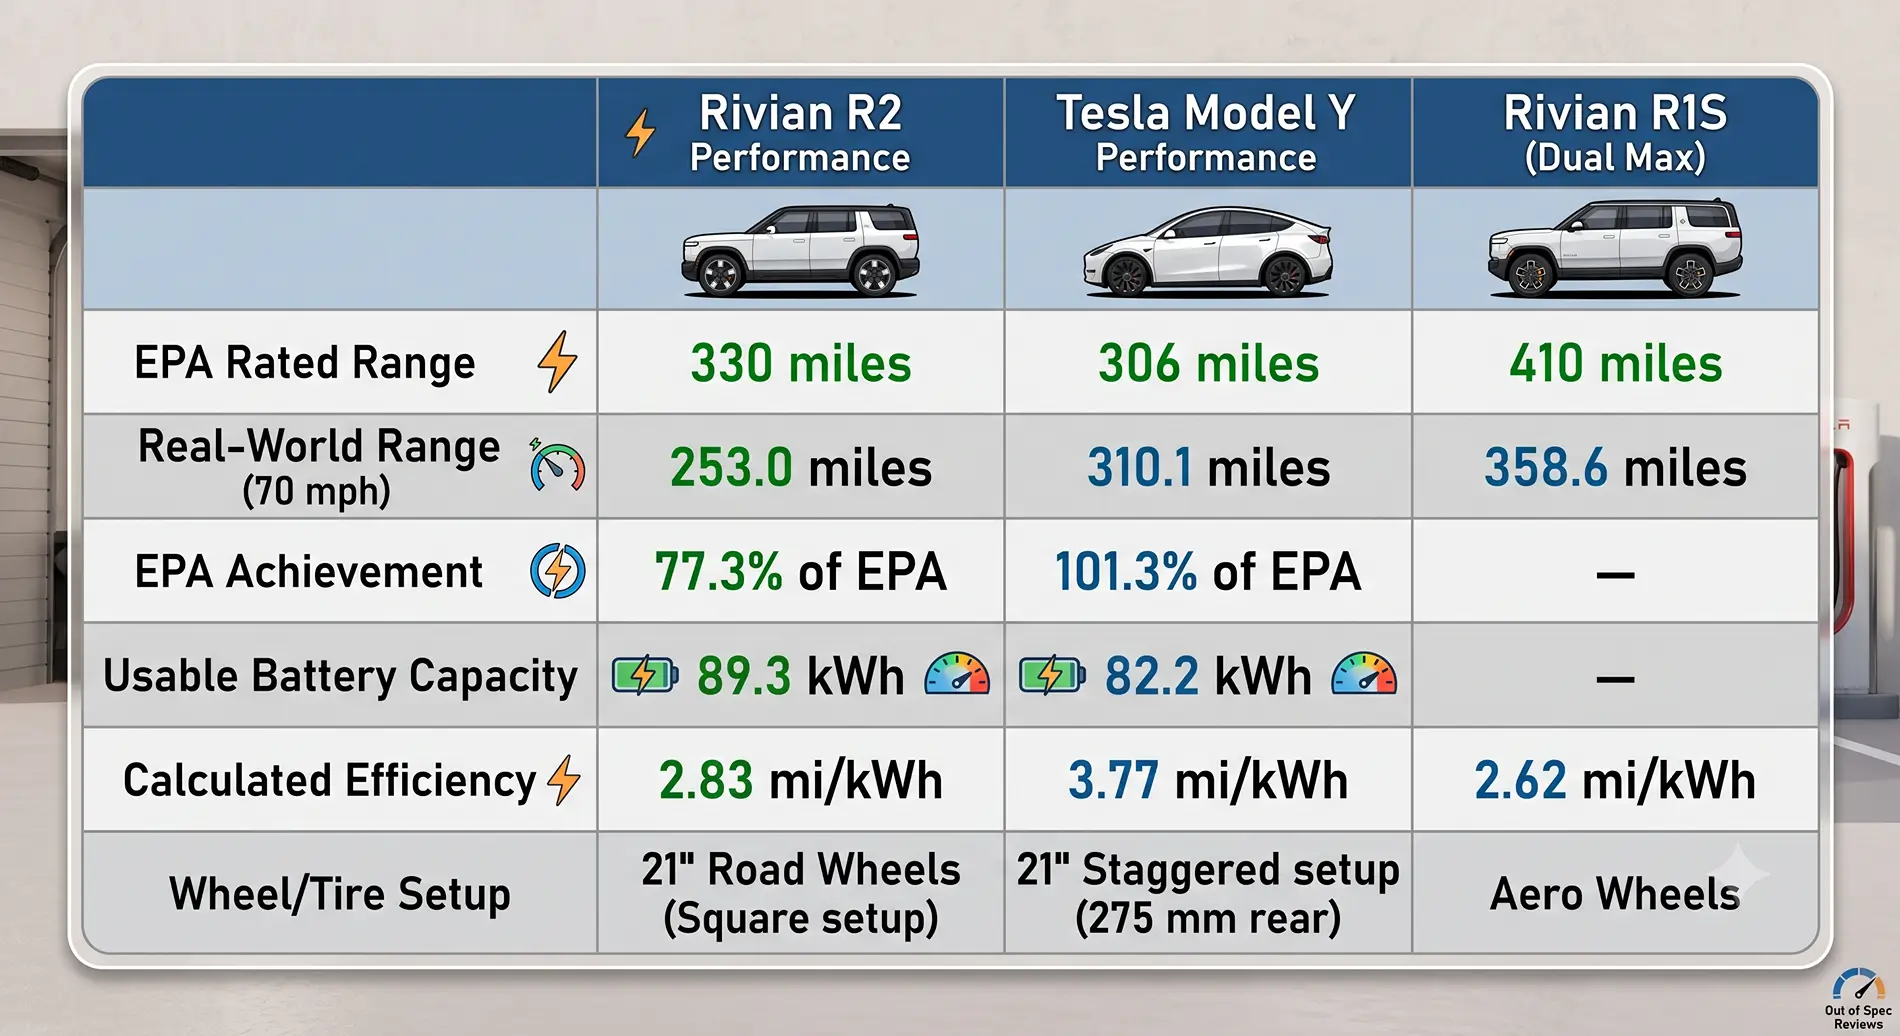
- Shutdown: Reached 0% range display at ~250 miles [44:06]. It ran an additional ~5 miles into its bottom buffer before entering "Turtle Mode" and dropping below 70 mph at 253 real-world miles [46:13].
- Battery Discharge: Outputted 89.3 kWh, which is slightly higher than Rivian's official claim of 87.9 kWh usable capacity [01:01:17].
- Performance Curve: Drove roughly 18 miles past the point where the R2 ran out of battery [41:00]. It hit 0% range display right at 300 miles [54:12].
- Shutdown: At 317.8 miles indicated (310.1 miles adjusted), the vehicle displayed a sudden "Unable to drive" warning and cut motive power directly while maintaining 70 mph [55:44], [57:37].
- Efficiency: Achieved an impressive 3.77 mi/kWh despite having wider 275 mm rear tires [01:06:28].
- Travelled 358.6 miles—over 100 miles farther than the R2—due to its significantly larger battery pack [01:08:38].
- Efficiency was fairly close to the R2 (2.62 mi/kWh vs. 2.83 mi/kWh), showing that the smaller R2 is not substantially more aerodynamic or energy-efficient than its larger sibling at 70 mph highway speeds [01:09:19].
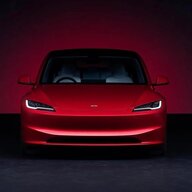
- The EPA Gap: On paper, the Rivian R2 advertises 24 miles more range than the Tesla Model Y (330 mi vs. 306 mi). In real-world 70-mph testing, the Tesla went 57 miles farther than the Rivian R2 [01:07:19].
- Manufacturer Calibration Differences: The hosts emphasized that this discrepancy stems from how manufacturers run EPA test cycles. Tesla tends to voluntarily under-rate or choose cycles that reflect highway cruising, while Rivian chose a cycle setting (and conserve mode offsets) that maximizes the advertised EPA sticker number [01:04:51].
- Aerodynamics: The R2's boxier "brick-like" body shape creates higher wind resistance at 70 mph compared to the streamlined shape of the Model Y [01:01:48].
Sponsored